
Application of novel DEA-SWARA-WASPAS model for efficiency assessment of agricultural products

Abstract
Aim: The aim of the research was to create an original model for assessing the efficiency of production lines for five agricultural products. The purpose was to determine, based on the developed model, which production lines are efficient and which are not efficient.
Methods: An original integrated model was created that includes the Data Envelopment Analysis (DEA), Stepwise Weight Assessment Ratio Analysis (SWARA) and Weighted Aggregates Sum Product Assessment (WASPAS) methods. DEA was applied as a linear programming model to determine the efficiency of five agricultural products based on eight inputs and one output. After that, SWARA was applied to determine the weight values of criteria, and WASPAS was applied to the final ranking of alternatives.
Results: The results show that 2 of the 5 production lines were not efficient, and they were further eliminated from the model. To determine the final ranking of production lines for other agricultural products, the SWARA-WASPAS model was implemented. The final results show that Alternative A2 (corn) is ranked as first, i.e., the most significant (0.933). Alternative A5 (seeds) is ranked second in terms of significance (0.874), while Alternative A1 (wheat) (0.769) is in third position.
Conclusion: It this paper, an original integrated model is developed, which represents the contribution of the research. In addition, the results show that the enterprise should focus mostly on the production of corn, i.e., focus its resources mostly on the production of this crop.
Keywords
INTRODUCTION
In order for the enterprise’s management to be able to make the right decisions and perform them in the right way, it is necessary to face real facts in the enterprise on a daily basis. It is not sufficient just to observe the results achieved in the past, but managers must rely on the current situation in the enterprise and solve problems with timely and right decisions. This paper is based on the research conducted in a particular enterprise engaged in agricultural production. The production is diverse, and many operations that lead to the finished product are performed in that process. In this paper, the efficiency of production lines is evaluated using an integrated developed Data Envelopment Analysis (DEA)-Stepwise Weight Assessment Ratio Analysis (SWARA)-Weighted Aggregates Sum Product Assessment (WASPAS) model. After the efficiency assessment, the production lines evaluated as efficient in the previous step are ranked using the SWARA and WASPAS methods. The model used in this study, therefore, represents a combination of DEA, SWARA and WASPAS methods for application at different calculation stages in this research.
The aim of this paper is to enable the enterprise to make a decision on how best to allocate resources to gain maximum business results, i.e., which production line is the most efficient; to which the most attention should be paid; and which should potentially be excluded from the production process.
The main contribution of the paper is the development of a decision-making model using a combination of the above-mentioned methods. This integrated model is presented for the first time in this paper.
This Introduction is followed by a review of the existing literature that deals with the problems of decision-making and the application of the given methods. Section 3 includes the development of the methodology that is used in the paper. Section 5 refers to the case study and results, where we applied the developed model. Section 5 draws the conclusions.
LITERATURE REVIEW
The relevance of the proposed methods is evidenced by the large number of contemporary studies in which they are used. The review of existing literature clearly proves that the DEA method is applicable in agricultural production. Yang and Shang[1] used planting area, seed consumption, labor input, pesticide usage and chemical fertilizer usage as input indicators in their research, while agricultural production was chosen as an output, and the traditional DEA model was used to calculate the production efficiency of small agricultural enterprises. They found that the efficiency of their production was low. The results obtained by Raheli et al.[2] during their research applying the DEA method show that there were significant differences between efficient and inefficient farmers in the studied area. The main differences were in the use of chemical fertilizers, biocides and water for irrigation, i.e., better use of them would probably increase efficiency in the long term. In their research, Gunes and Guldal[3] included 550 agricultural enterprises and determined by the DEA method that agricultural enterprises in Turkey do not use capital effectively. Pishgar-Komleh et al.[4] measured the efficiency of farms in Poland using the DEA method and thus helped farmers to obtain a realistic and reliable pattern of raw material usage in a winter wheat production system, whereby the greatest production can be achieved in conjunction with the lowest possible environmental impact. Vlontzos and Pardalos[5] used the DEA method to measure the environmental efficiency of agricultural production in European Union (EU) countries and showed that less developed countries have low environmental efficiency rates, as do those countries whose total production largely depends on arable crops. Angulo-Meza et al.[6] measured the environmental efficiency of blueberry production by developing a new model within the LCA + DEA approach. Guth and Smędzik-Ambroży[7] identified the significance of differences in land, capital and labor endowments on the efficiency of different agricultural production types in the EU. By using the DEA method, they showed that the efficiency of transforming inputs into effects in EU-12 regions in 2015 was higher than for households in EU-15 regions. In addition to agricultural production, the DEA method is also used to measure efficiency in other sectors of the economy. Gong et al.[8] evaluated the energy efficiency of the use of three key factors, raw material composition, cracking depth and load rate, in ethylene production using the DEA model. Lo Storto[9] measured the efficiency of Italian airports using the DEA method. Zeng et al.[10] used the DEA method to analyze the efficiency of China’s thermal power industry. Geng et al.[11] used the DEA method to evaluate the efficiency of production processes in complex petrochemical industries.
The SWARA and WASPAS methods are often used to assess criteria and rank alternatives in research when forming decision-making models. Sremac et al.[12] used the rough SWARA and WASPAS models to evaluate suppliers in the field of logistics. Yücenur and Ipekçi[13] discussed the problem of location selection for the first Turkish current energy production plant planned to be established. The criteria in their proposed model are weighted with the SWARA method and the alternatives are ranked by WASPAS method. Baç[14] used the SWARA and WASPAS models, and the results reveal that all smart card systems show improvements under the criteria of performance, reliability and user satisfaction. When assessing the criteria of digital libraries, Yörükoğlu and Aydın[15] used the SWARA and WASPAS models. To evaluate and prioritize key supplier selection indicators and establish a link between available alternatives and selected indicators, Singh and Modgil[16] used the SWARA and WASPAS.
After an overview of the above-mentioned research, we can conclude that the integration of DEA, SWARA and WASPAS methods does not exist in the literature; thus, this study can contribute to the overall literature.
METHODS
Data Envelopment Analysis model
CCR (Charnes, Cooper and Rhodes) is the most basic DEA model. The model was presented by
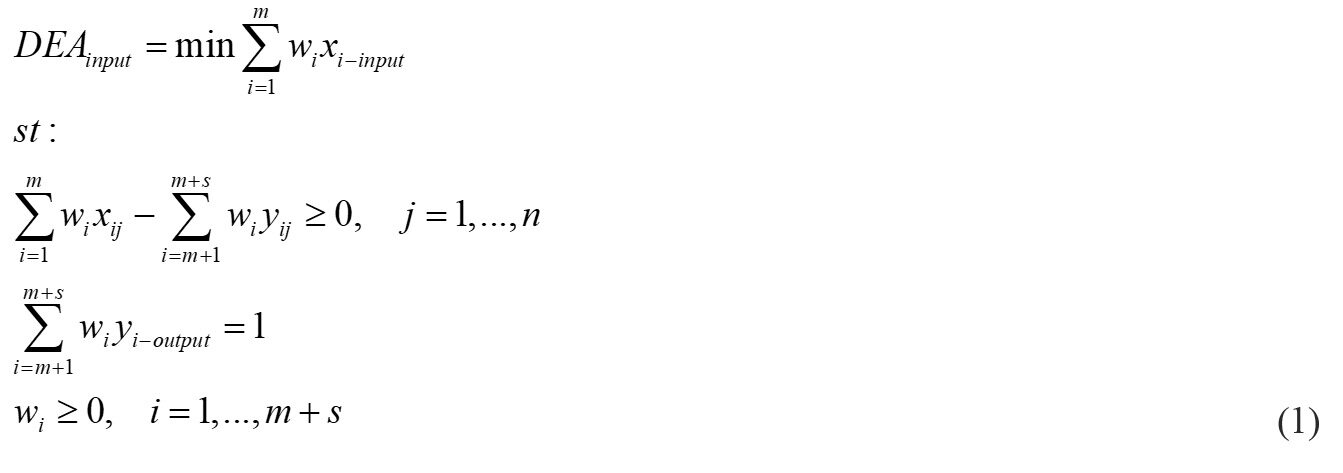
If DEAinput = 1, the model shows efficiency, while, if DEAinpu≥ 1, the model shows inefficiency.
The Decision-Making Unit (DMU) consists of m input parameters for each alternative xij, while s represents the output parameters for each alternative yij, taking into account the weights of the parameters denoted by wi. In addition, n represents the total number of DMUs.
The DEA CCR output oriented model (max) is:
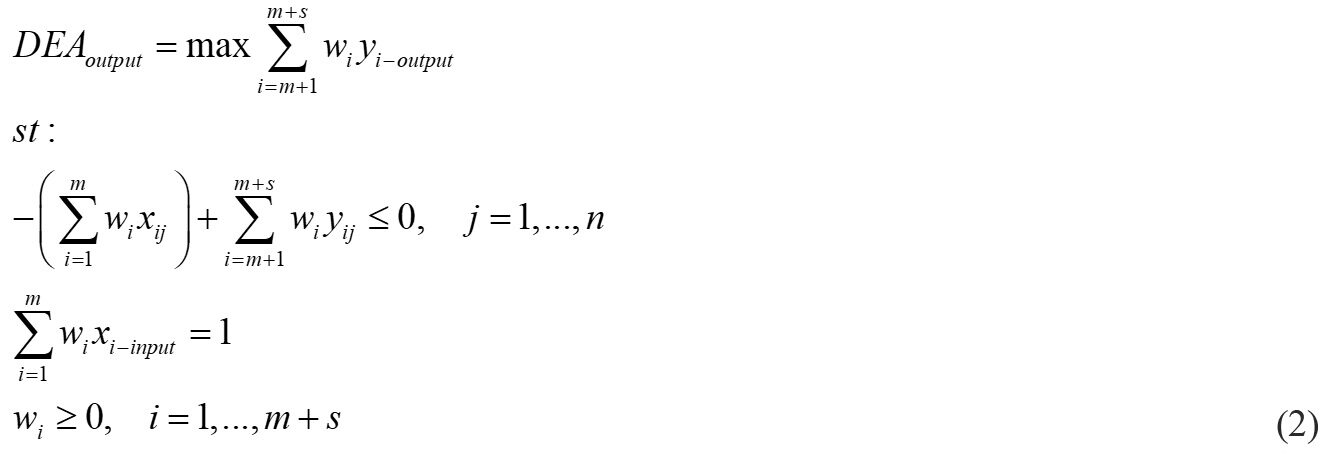
If DEAoutput= 1, the model shows efficiency, while, if DEAoutput≤ 1, the model shows inefficiency.
Then, Equation (3) can be applied to determine the final efficiency of production lines.
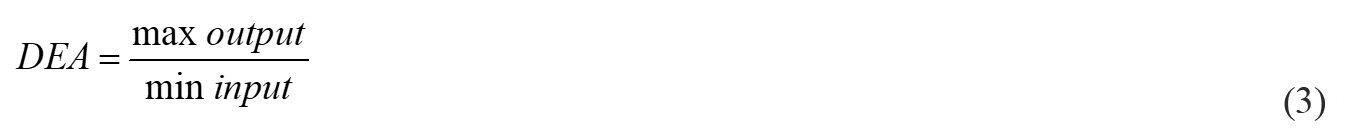
Production lines that have a value of 1 are further implemented in the model.
Stepwise Weight Assessment Ratio Analysis method
The SWARA method is one of the methods for determining weight values that play an important role in a decision-making process. The method was developed by Keršuliene et al.[18] and, according to them, its basic characteristic is the possibility of assessing the opinion of experts on the significance of criteria in the process of determining their weights. After defining and forming the list of criteria involved in a decision-making process, the SWARA method consists of the following steps.
Step 1: Criteria need to be sorted according to their significance. In this step, experts perform the ranking of defined criteria according to the significance they have, for example, the most significant is in first place, the least significant is in last place, and the criteria between them have ranked significance.
Step 2: Determine sj, which is the comparative importance of average value. Starting from the second ranked criterion, it is necessary to determine their significance in the following way. It is determined how much more important criterion cjis than criterion cj+1.
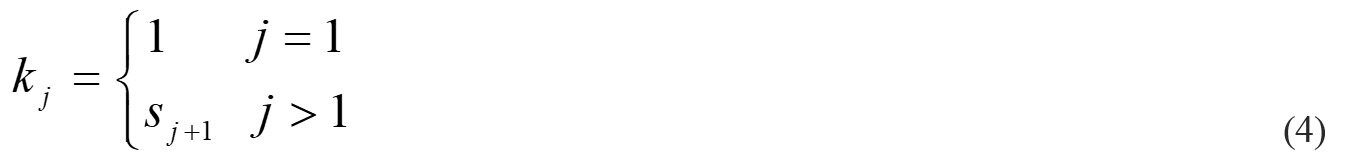
Step 3: Calculate the coefficient kj as follows:
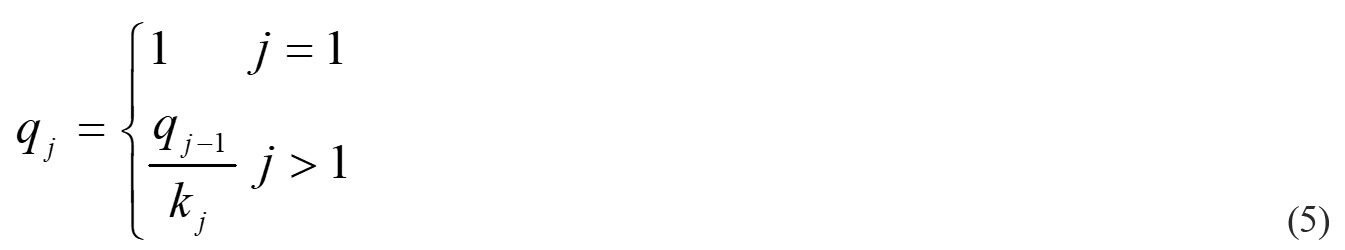
Step 4: Determine the recalculated weight qj as follows:
Step 5: Calculate the weight values of criteria with the sum that is equal to one:
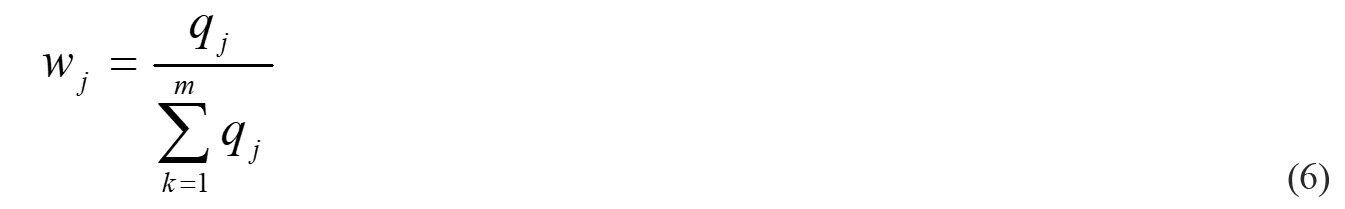
where wj represents the relative weight value of criteria.
Weighted Aggregates Sum Product Assessment method
The WASPAS method[19] is a relatively new MCDM method that is derived from two methods: the Weighted Sum Model (WSM) and the Weighted Product Model (WPM).
The WASPAS method consists of the following steps:
Step 1: Form an initial decision matrix (X). As a first step, m alternatives are evaluated according to n criteria (C1, C2, ..., Cn). Alternatives are represented by Ai = (xi1, xi2, …, xin) vectors where xijis the value of the ith alternative according to the jth criterion (i = 1, 2, …, m; j = 1, 2, …, n).
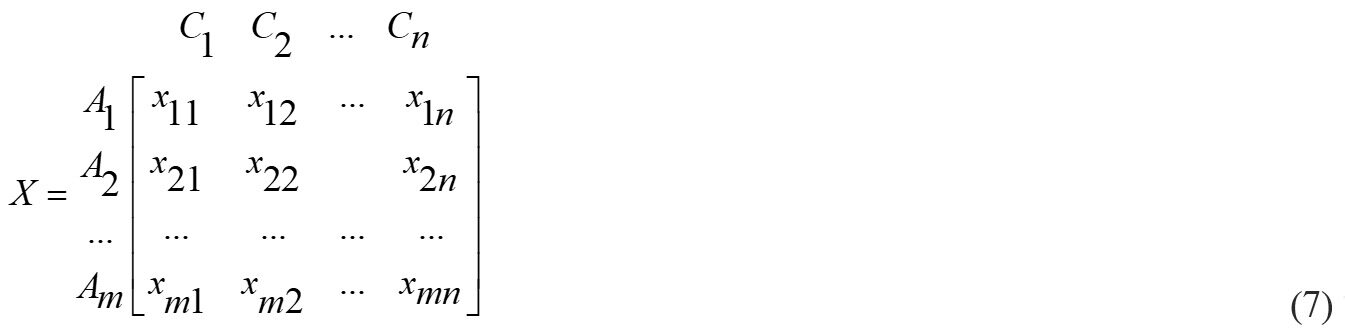
where m denotes the number of alternatives and n denotes the total number of criteria.
Step 2: Normalize the initial matrix using the following equations:
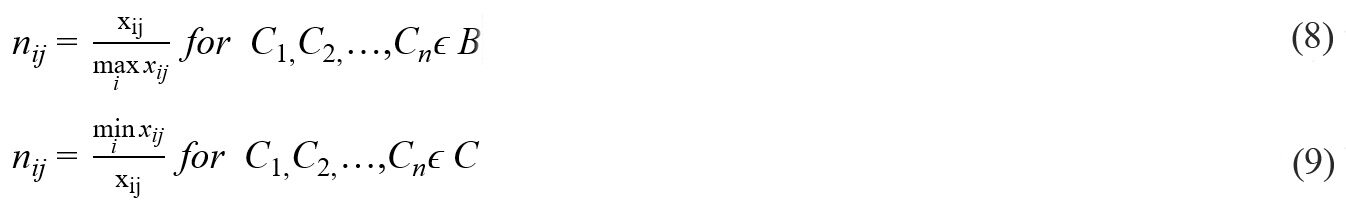
where B denotes benefit criteria, while C denotes cost criteria.
Step 3: Weight the normalized matrix by multiplying the previously obtained matrix with the weight values of the criteria:
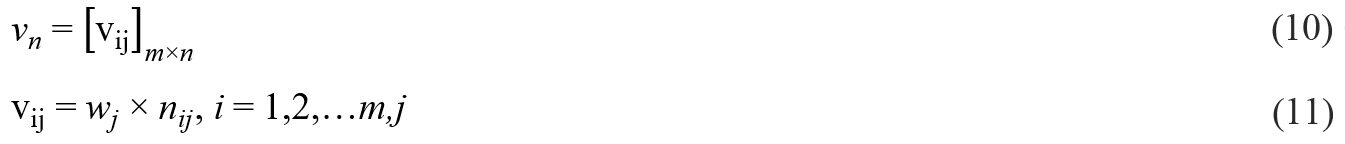
Step 4: Sum all values of obtained alternatives (summation by rows):
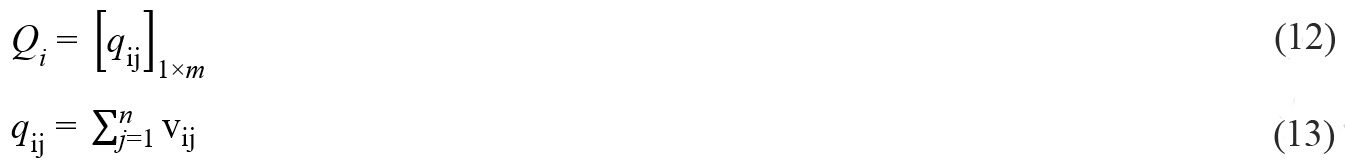
Step 5: Determine the weighted product model by applying the following:
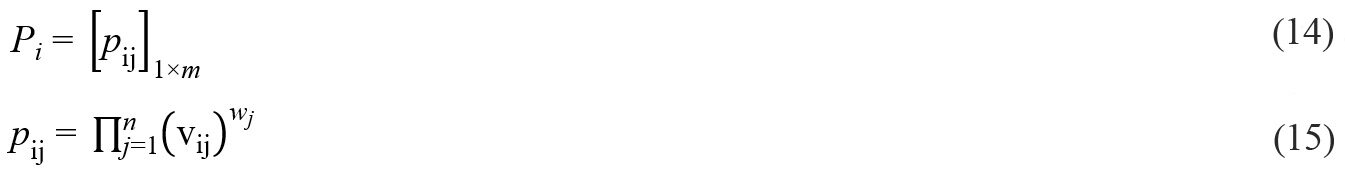
Step 6: Determine the relative values of alternatives Ai:
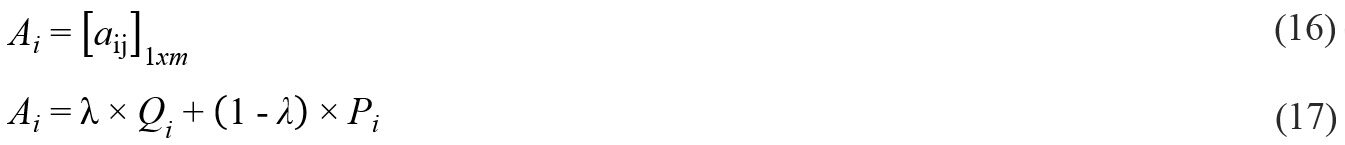
The coefficient λ can be a crisp value and ranges 0, 0.1, 0.2, … 1.0.
Step 7: Rank the alternatives. The highest value of alternatives indicates the best-ranked, while the lowest value reflects the worst alternative.
RESULTS
The research for the purposes of this paper was conducted in an enterprise that is classified as a small enterprise since it employs 26 workers. The enterprise was founded in 1956 and has not changed the core-activity of its business since then. The enterprise performs production, classified as mixed agricultural production, where the products are divided into 2 groups. The first group consists of four products from the field of crop production: wheat, corn, soybeans and oilseed rape. The second group consists of products from the field of seed production (corn seed, wheat seed, barley seed and triticale seed), which are marked as seeds in this paper. Production is carried out on 500 ha, which represents a large area of land and a large annual crop yield. Wheat production is carried out on 240 ha of land and is the largest part of the total production. The total wheat yield on that area is 1440 tons. On an area of 50 ha of land, 300 tons of corn are produced. Soybeans are produced on 45 ha of land and the total yield is 113 tons. Oilseed rape covers 100 ha of arable land and 300 tons are produced on that area. Seed production is carried out on 65 ha of land and the total amount of the product is 400 tons. Production is carried out in the territory of the municipality of Derventa, while the placement of products is performed both in the country and abroad. Therefore, the enterprise is one of the larger exporters of these agricultural products in Bosnia and Herzegovina. Until now, the enterprise has sold its products exclusively directly to consumers. The data collected are given in Table 1 and relate to production and workers performing various operations to achieve production of given quantities of products.
Data for production lines
| Workers by operations | |||||||||
| Products | Quantity (tons) | Land prep. | Sowing | Replen. | Chem. treat. | Harvest | Drying | Purif. | Fumigation |
| Wheat | 1440 | 10 | 8 | 3 | 3 | 5 | 2 | 12 | 2 |
| Corn | 300 | 10 | 8 | 3 | 3 | 5 | 2 | 2 | 1 |
| Soybeans | 113 | 10 | 8 | 3 | 3 | 5 | 2 | 7 | 1 |
| Oilseed rape | 300 | 10 | 8 | 3 | 3 | 5 | 2 | 10 | 1 |
| Seeds | 6 | 10 | 5 | 3 | 3 | 5 | 2 | 14 | 1 |
Thus, in Table 1, we see that the enterprise produces 5 products, and the next data we have are the quantities (tons) of the products produced. The following are the 8 operations performed during the production of these 5 products. The total quantity of wheat produced, on the mentioned area of 240 ha, is 1440 tons. To produce this quantity, 10 workers work on land preparation, 8 workers do sowing and then 3 workers each work on replenishment and chemical treatment. After that, there is harvest, which is performed by 5 workers using the available mechanization. After harvest, there is the drying operation, which is performed in specialized dryers. The tasks for this operation are performed by 2 workers. After drying, the wheat grain is purified by a conveyor belt and workers. This operation is performed by 12 workers. After the grain is purified, fumigation is performed. Fumigation is a process of chemical treatment of grains with photoxin, which protects the grain from insects. This operation is performed by 2 workers, trained to handle chemical agents.
Corn is produced on 50 ha of land, and the yield on that area is 300 tons. For the realization of this operation, 10 workers are engaged in the preparation of the land. Sowing is performed by 8 workers, while replenishment and chemical treatment of crops are performed by 3 workers each. The corn harvest, with modern mechanization, is performed by 5 workers. After harvest, the corn grain is dried. The tasks for this operation are performed by 2 workers. Purification of corn grains is performed by 2 workers. Purification is also performed on a conveyor belt. Purification is followed by fumigation, which is performed by 1 worker.
The amount of soybeans produced on 45 ha of land is 113 tons. Operations are performed in the same order as with the previous crops. 10 workers work on land preparation, 8 workers on sowing and 3 workers on replenishment and chemical treatment. Harvesting is performed by 5 workers using available mechanization. Harvest is followed by drying operations, which are performed by 2 workers; purification, which is performed by 7 workers; and fumigation, which is performed by 1 worker.
In total, 300 tons of oilseed rape are produced on the mentioned area of 100 ha. To reach this amount, the same operations are performed as with previous crops. The first operation is land preparation by 10 workers, followed by sowing (8 workers), replenishment (3 workers), chemical treatment (3 workers), harvesting (5 workers), drying (2 workers), purification (10 workers) and fumigation (1 worker).
Seeds are produced on 65 ha of land. In total, 400 tons of seeds are produced on this area. To produce this quantity, 11 operations need to be performed. The first eight operations are common to the aforementioned crops. The operation of land preparation is performed by 10 workers and sowing by 5 workers. Replenishment and chemical treatment operations are performed by 3 workers each. The seeds are harvested by 5 workers, while drying and purification are performed by 2 and 14 workers, respectively. Seed fumigation is performed by 1 worker.
Application of DEA method for determining production efficiency
In this section, the production efficiency of each product is evaluated using the DEA method. To apply this method to the production process, we need data on the current production quantity [Table 1]. Equation (1) is used to minimize the number of workers for wheat production:
Min = 10w1 + 8w2 + 3w3 + 3w4 + 5w5 + 2w6 + 12w7 + 2w8;
10w1 + 8w2 + 3w3 + 3w4 + 5w5 + 2w6 + 12w7 + 2w8 - (1440w9) ≥ 0;
10w1 + 8w2 + 3w3 + 3w4 + 5w5 + 2w6 + 2w7 + 1w8 - (300w9) ≥ 0;
10w1 + 8w2 + 3w3 + 3w4 + 5w5 + 2w6 + 7w7 + 1w8 - (113w9) ≥ 0;
10w1 + 8w2 + 3w3 + 3w4 + 5w5 + 2w6 + 10w7 + 1w8 - (300w9) ≥ 0;
10w1 + 5w2 + 3w3 + 3w4 + 5w5 + 2w6 + 14w7 + 0w8 - (400w9) ≥ 0;
1440w9 = 1;
w1 > 0; w2 > 0; w3 > 0; w4 > 0; w5 > 0; w6 > 0; w7 > 0; w8 >0; w9 > 0;
and thus, for each product individually, using Lingo 18.0 software, we obtain the following results:
DEAmininput for wheat = 1
DEAmininput for corn = 1
DEAmininput for soybeans = 6.624526
DEAmininput for oilseed rape = 2.780952
DEAmininput for seeds = 1
The inputs, in this case, are workers who perform operations during the production of the given quantities of products listed in Table 2. The above results were obtained by pplying the DEA method for measuring efficiency of the production process and the use of inputs for each product. The results show that the production of 3 products (wheat, corn and seeds) is efficient (DEAinput = 1), while DEAinput for soybeans = 6.624526 and DEAmininput for oilseed rape = 2.780952 (i.e., DEAinput ≥ 1), which implies that the production of soybeans and oilseed rape is inefficient in terms of minimizing the input.
Weights of the criteria obtained using the stepwise weight assessment ratio analysis method
| Sj | Kj= Sj + 1 | qj | wj | |
| C2 | 1.000 | 1.000 | 1.000 | 0.162 |
| C3 | 0.05 | 1.050 | 0.952 | 0.154 |
| C5 | 0.15 | 1.150 | 0.828 | 0.134 |
| C1 | 0.05 | 1.050 | 0.789 | 0.127 |
| C4 | 0.05 | 1.050 | 0.751 | 0.121 |
| C6 | 0.15 | 1.150 | 0.653 | 0.106 |
| C8 | 0.05 | 1.050 | 0.622 | 0.101 |
| C7 | 0.05 | 1.050 | 0.592 | 0.096 |
| ∑ | 6.188 | 1.000 |
Further, it is necessary to maximize the output, i.e., the amount of products produced. Equation (2) is used to maximize the amount of wheat:
MAX = 1440w9;
-10w1 - 8w2 - 3w3- 3w4- 5w5- 2w6 - 12w7 - 2w8 + (1440w9) ≤ 0;
-10w1 - 8w2 - 3w3 - 3w4 - 5w5 - 2w6 - 2w7 - 1w8 + (300w9) ≤ 0;
-10w1 - 8w2 - 3w3 - 3w4 - 5w5 - 2w6 - 7w7 - 1w8 + (113w9) ≤ 0;
-10w1 - 8w2 - 3w3 - 3w4 - 5w5 - 2w6 - 10w7 - 1w8 + (300w9) ≤ 0;
-10w1 - 5w2 - 3w3 - 3w4 - 5w5 - 2w6 - 14w7 - 0w8 + (400w9) ≤ 0;
10w1 + 8w2 + 3w3 + 3w4 + 5w5 + 2w6 + 12w7 + 2w8 = 1;
w1 > 0; w2 > 0; w3> 0; w4 > 0; w5 > 0; w6 > 0; w7 > 0; w8 > 0; w9 > 0;
and thus, for each product individually, using Lingo 18.0 software, we obtain the following results:
DEAmax wheat = 1
DEAmaxcorn = 1
DEAmaxsoybeans = 0.1509542
DEAmaxoilseed rape = 0.3595890
DEAmaxseeds = 1
Based on the results, we see that the soybean production (DEAsoybeans = 0.4783069) and oilseed rape (DEAmaxoilseed rape = 0.3595890) are inefficient, i.e., DEAoutput < 1.
By applying Equation (3), we determine the final efficiency:
DEAwheat = 1/1 = 1
DEAcorn = 1/1 = 1
DEAsoybeans = 0.1509542/6.624526 = 0.0227871
DEAoilseed rape = 0.3595890/2.780952 = 0.1293042
DEAseeds = 1/1 = 1
In this way, we determine the final efficiency of the production lines. The final efficiency of soybean production is equal to 0.0227871 (inefficient), which means that it is excluded further from the model. The final efficiency of oilseed rape production is equal to 0.1293042 (inefficient), which means that this production line is also excluded from the model. The production efficiencies of wheat, corn and seeds are equal to one (efficient), thus they are implemented in the model.
For the purposes of applying the stated methods, the operations are denoted as Criteria C1-C8: (C1) land preparation; (C2) sowing; (C3) replenishment; (C4) chemical treatment; (C5) harvest; (C6) drying; (C7) purification; and (C8) fumigation.
Products, i.e., production lines, are marked as Alternatives A1-A5: (A1) wheat; (A2) corn; (A3) soybeans; (A4) oilseed rape; and (A5) seeds.
Application of Stepwise Weight Assessment Ratio Analysis method for determining criterion weights
Applying the SWARA method, it is first necessary to rank the criteria in terms of their significance based on the ratings of the decision-maker, as shown in Table 2.
After ranking, in the second step, it is necessary for decision-makers to determine how much more significant criterion cj is in comparison to criterion cj+1. The first space in the second column always has a value of 1.00, while the others indicate the dominance of one criterion compared to the next one. For example, Criterion C2 is more significant by 0.05 than C3, while C3 is more significant by 0.15 than C5, and so on.
Applying the third step of the SWARA method, i.e., Equation (4), the values of the coefficient Kj in the third column are obtained. In the fourth step, applying Equation (5), the recalculated weight qj is obtained. For example, q3= 1/1.050 = 0.952, q5= 0.952/1.150 = 0.828, etc.
In the fifth step, using Equation (6), weight values of criteria are calculated such that their sum is equal to one: w2 = 1/6.188 = 0.162, w3 = 0.952/6.188 = 0.154, w5 = 0.828/6.188 = 0.134, etc.
Based on Table 2, it can be concluded that the second criterion is the most significant, that is, the most significant operation in the production of these crops is sowing. The expert assessed that the second most significant criterion refers to replenishment operation, followed by harvest. The next most significant criterion refers to the operation of land preparation. This is followed by the criterion related to chemical treatment operations, followed by the criterion related to the drying operation. In the penultimate and last positions are the criteria related to fumigation operation and purification operation, respectively.
Application of the Weighted Aggregates Sum Product Assessment method for the final ranking of alternatives
The first step is to form an initial matrix [Table 3].
Initial matrix
| C1 | C2 | C3 | C4 | C5 | C6 | C7 | C8 | |
| A1 | 10 | 8 | 3 | 3 | 5 | 2 | 12 | 2 |
| A2 | 10 | 8 | 3 | 3 | 5 | 2 | 2 | 1 |
| A5 | 10 | 5 | 3 | 3 | 5 | 2 | 14 | 1 |
Then, the initial matrix is normalized [Table 4].
Normalized initial matrix
| C1 | C2 | C3 | C4 | C5 | C6 | C7 | C8 | |
| A1 | 1.000 | 0.625 | 1.000 | 1.000 | 1.000 | 1.000 | 0.167 | 0.500 |
| A2 | 1.000 | 0.625 | 1.000 | 1.000 | 1.000 | 1.000 | 1.000 | 1.000 |
| A5 | 1.000 | 1.000 | 1.000 | 1.000 | 1.000 | 1.000 | 0.143 | 1.000 |
Normalization is performed by Equation (9).
n12 = 5/8 = 0.625
The next step is weighting the normalized matrix such that the previously obtained matrix needs to be multiplied by the weight values of the criteria obtained by the SWARA method [Table 5].
Weighted normalized matrix
| C1 | C2 | C3 | C4 | C5 | C6 | C7 | C8 | WSM | |
| A1 | 0.127 | 0.101 | 0.154 | 0.121 | 0.134 | 0.106 | 0.016 | 0.050 | 0.809 |
| A2 | 0.127 | 0.101 | 0.154 | 0.121 | 0.134 | 0.106 | 0.096 | 0.101 | 0.939 |
| A5 | 0.127 | 0.162 | 0.154 | 0.121 | 0.134 | 0.106 | 0.014 | 0.101 | 0.918 |
Weighting the normalized matrix is performed by Equation (11).
v12 = 0.162 × 0.625 = 0.101
After weighting, all values of the obtained alternatives are summed (summation by rows) applying Equation (13).
q11 = 0.127 + 0.101 + 0.154 + 0.121 + 0.134 + 0.106 + 0.016 + 0.050 = 0.809
The next step is to determine the weighted product model [Table 6] by Equation (15).
Ranking the alternatives
| WPM | Ai | WASPAS | |
| A1 | 0.728 | 0.769 | 3 |
| A2 | 0.927 | 0.933 | 1 |
| A5 | 0.830 | 0.874 | 2 |
1.0000.162 × 0.6250.154 × 1.0000.134 × 1.0000.127 × 1.0000.121 × 1.0000.106 × 0.1670.101 × 0.5000.096 = 0.728
The value of λ usually takes the mean value, 0.5.
This is followed by determining the relative values of alternatives Ai[Table 6].
A1 = 0.5 × 0.809 + (1-0.5) × 0.728 = 0.769
Finally, the alternatives are ranked according to the obtained values [Table 6].
Ranking using the WASPAS method shows that Alternative A2 (corn) is ranked first, i.e., is most significant (0.933). Alternative A5 (seeds) is ranked second in terms of significance (0.874), while in third place is Alternative A1 (wheat) (0.769). These results show that the enterprise should focus its resources and efforts mostly on corn production. Thus, corn production would make the greatest contribution to achieving maximum business results.
SENSITIVITY ANALYSIS
A sensitivity analysis was performed by including all λ coefficient values in the model [Figure 1].
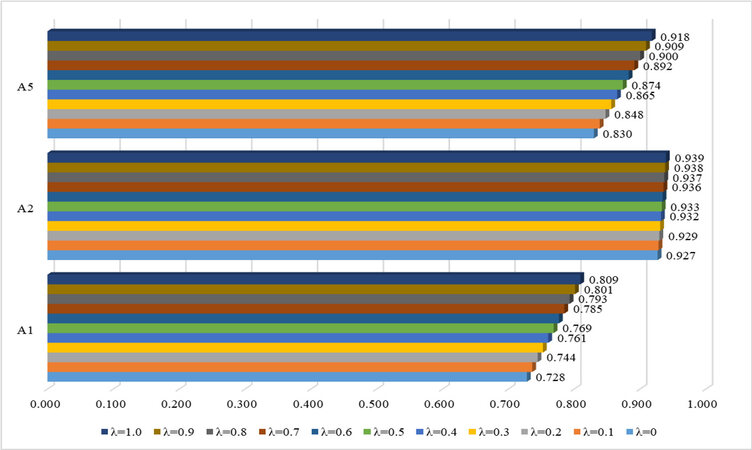
Figure 1. Ranking based on the λ coefficient.
Figure 1 shows the verification of the results of the WASPAS method including all values of the lambda coefficient in the model. These results show that the ranking of alternatives is the same as the initial ranking. In this case as well, Alternative A2 (corn) is in first place in terms of significance, while Alternatives A5 (seeds) and A1 (wheat) are in second and third place, respectively. A sensitivity analysis was also performed using Additive Ratio Assessment (ARAS)[20] and Evaluation Based on Distance from Average (EDAS)[21]. The results of the sensitivity analysis using these three methods are shown in Figure 2.
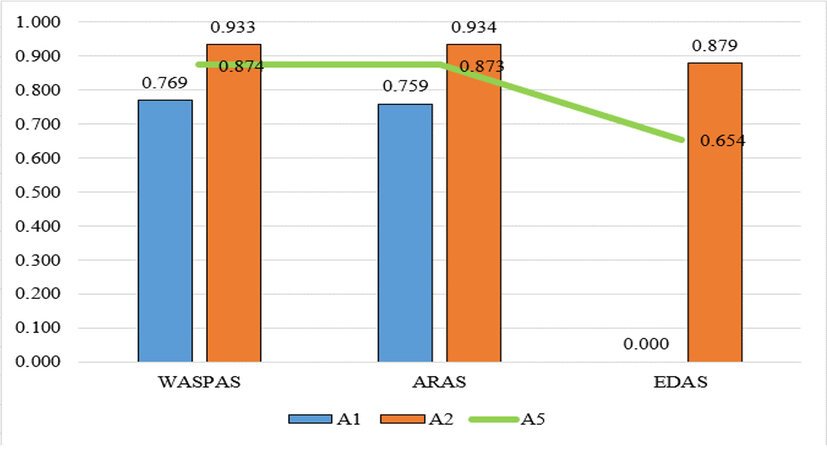
Figure 2. Sensitivity analysis using ARAS and EDAS. ARAS: Additive ratio assessment; EDAS: evaluation based on distance from average solution; WASPAS: weighted aggregates sum product assessment.
Figure 2 shows the results of the ARAS and EDAS methods. The ranking results using these methods were compared with the results of the WASPAS method. The figure clearly shows that there are no deviations compared to the previous ranking results. According to both ARAS and EDAS, Alternative A2 (corn) is in first place in terms of significance, while Alternatives A5 (seeds) and A1 (wheat) are in second and third place, respectively.
CONCLUSION AND DISCUSSION
This research was conducted in an enterprise engaged in the agricultural production of five types of products (wheat, corn, soybeans, oilseed rape and seeds). The model formed in this paper enables the enterprise to make a decision on which product to focus capacities the most, i.e., which of the production lines is the most significant. When creating the model, three methods were used: DEA, SWARA and WASPAS. DEA analysis was performed to determine the efficiency of production lines. The analysis showed that the production of wheat, corn and seeds proved to be efficient, while the production of soybeans and oilseed rape was inefficient, and they were further excluded from the model. Using the SWARA method, the criteria, i.e., business operations, were ranked in terms of significance. This method shows that the operation of sowing agricultural crops is the most significant. The WASPAS method was used to rank the alternatives, i.e., the production lines, in terms of significance, based on the criteria. The results of this method show that the most significant is the production of corn, followed by the production of seeds and wheat. These results show that the enterprise should focus on the production of corn, i.e., focus its resources on the production of this crop.
Future research could focus on removing soybeans and oilseed rape from production and on the results that such a move would cause. Additionally, future research is left with the question of investing additional funds in the production of corn and the results that such a decision would enable.
DECLARATIONS
Authors’ contributionsThe author contributed solely to the article.
Availability of data and materialsNot applicable.
Financial support and sponsorshipNone.
Conflicts of interestAll authors declared that there are no conflicts of interest.
Ethical approval and consent to participateNot applicable.
Consent for publicationNot applicable.
Copyright© The Author(s) 2021.
REFERENCES
1. Yang X, Shang G. Smallholders’ Agricultural Production Efficiency of Conservation Tillage in Jianghan Plain, China-Based on a Three-Stage DEA Model. Int J Environ Res Public Health 2020;17:7470.
2. Raheli H, Rezaei RM, Jadidi MR, Mobtaker HG. A two-stage DEA model to evaluate sustainability and energy efficiency of tomato production. Inf Process Agric 2017;4:342-50.
3. Gunes E, Guldal HT. Determination of economic efficiency of agricultural enterprises in Turkey: A DEA approach. New Medit 2019;18:4.
4. Pishgar-Komleh SH, Zylowski T, Rozakis S, Kozyra J. Efficiency under different methods for incorporating undesirable outputs in an LCA+ DEA framework: A case study of winter wheat production in Poland. J Environ Manage 2020;260:110138.
5. Vlontzos G, Pardalos PM. Assess and prognosticate green house gas emissions from agricultural production of EU countries, by implementing, DEA Window analysis and artificial neural networks. Renew Sust Energ Rev 2017;76:155-62.
6. Angulo-Meza L, González-Araya M, Iriarte A, Rebolledo-Leiva R, de Mello JCS. A multiobjective DEA model to assess the eco-efficiency of agricultural practices within the CF + DEA method. Comput Electron Agric 2019;161:51-161.
7. Guth M, Smędzik-Ambroży K. Economic resources versus the efficiency of different types of agricultural production in regions of the European Union. Economic research-Ekonomska istraživanja 2020;33:1036-51.
8. Gong S, Shao C, Zhu L. Energy efficiency evaluation based on DEA integrated factor analysis in ethylene production. Chin J Chem Eng 2017;25:793-9.
9. Storto C. The analysis of the cost-revenue production cycle efficiency of the Italian airports: A NSBM DEA approach. J Air Transp Manag 2018;72:77-85.
10. Zeng X, Zhou Z, Liu Q, Xiao H, Liu W. Environmental efficiency and abatement potential analysis with a two-stage DEA model incorporating the material balance principle. Comput Ind Eng 2020;148:106647.
11. Geng Z, Zeng R, Han Y, Zhong Y, Fu H. Energy efficiency evaluation and energy saving based on DEA integrated affinity propagation clustering: Case study of complex petrochemical industries. Energy 2019;179:863-75.
12. Sremac S, Stević Ž, Pamučar D, Arsić M, Matić B. Evaluation of a third-party logistics (3PL) provider using a rough SWARA-WASPAS model based on a new rough dombi aggregator. Symmetry 2018;10:305.
13. Yücenur GN, Ipekçi A. SWARA/WASPAS methods for a marine current energy plant location selection problem. Renewable Energy 2020;163:1287-98.
14. Baç U. An Integrated SWARA-WASPAS Group decision making framework to evaluate smart card systems for public transportation. Mathematics 2020;8:1723.
15. Yörükoğlu M, Aydın S. Digital library evaluation by SWARA-WASPAS method. International Journal of Industrial and Manufacturing Engineering 2020;14:449-52. Available from:
16. Singh RK, Modgil S. Supplier selection using SWARA and WASPAS-a case study of Indian cement industry. Meas Bus Excell 2020;24:243-65.
17. Charnes A, Cooper WW, Rhodes E. Measuring the efficiency of decision making units. Eur J Oper Res 1978;2:429-44.
18. Keršuliene V, Zavadskas EK, Turskis Z. Selection of rational dispute resolution method by applying new step-wise weight assessment ratio analysis (SWARA). J Bus Econ Manag 2010;11:243-58.
19. Zavadskas EK, Turskis Z, Antucheviciene J, Zakarevicius A. Optimization of weighted aggregated sum product assessment. Elektron ir elektrotechnika 2012;122:3-6.
20. Zavadskas EK, Turskis Z. A new additive ratio assessment (ARAS) method in multicriteria decision-making. Technol Econ Dev Econ 2010;16:159-72.
Cite This Article
Export citation file: BibTeX | RIS
OAE Style
Zavadskas EK, Đalić I, Stević Ž. Application of novel DEA-SWARA-WASPAS model for efficiency assessment of agricultural products. J Smart Environ Green Comput 2021;1:32-46. http://dx.doi.org/10.20517/jsegc.2020.02
AMA Style
Zavadskas EK, Đalić I, Stević Ž. Application of novel DEA-SWARA-WASPAS model for efficiency assessment of agricultural products. Journal of Smart Environments and Green Computing. 2021; 1(1): 32-46. http://dx.doi.org/10.20517/jsegc.2020.02
Chicago/Turabian Style
Zavadskas, Edmundas Kazimieras, Irena Đalić, Željko Stević. 2021. "Application of novel DEA-SWARA-WASPAS model for efficiency assessment of agricultural products" Journal of Smart Environments and Green Computing. 1, no.1: 32-46. http://dx.doi.org/10.20517/jsegc.2020.02
ACS Style
Zavadskas, EK.; Đalić I.; Stević Ž. Application of novel DEA-SWARA-WASPAS model for efficiency assessment of agricultural products. . J. Smart. Environ. Green. Comput. 2021, 1, 32-46. http://dx.doi.org/10.20517/jsegc.2020.02
About This Article
Copyright

Data & Comments
Data


 Cite This Article 73 clicks

 Like This Article 30
likes
Like This Article 30
likes


Comments
Comments must be written in English. Spam, offensive content, impersonation, and private information will not be permitted. If any comment is reported and identified as inappropriate content by OAE staff, the comment will be removed without notice. If you have any queries or need any help, please contact us at support@oaepublish.com.