
Damage prediction of transmission lines under typhoon disasters considering multi-effect


Abstract
Aim: It is necessary to study the resilience of transmission lines under typhoon disasters considering multi-effect, because typhoon disasters pose a great threat to coastal transmission lines and existing research ignored multi-effect and obtained conservative results.
Method: This paper proposes a method to predict the damage of transmission towers under typhoon disasters considering the multi-effect of tower-line coupling, aging, corrosion, guy wire reinforcement, etc. The tower-line coupling effect uses a two-step reliability model. The first step calculates the damage probability of transmission lines. Then, we couple the wind load of transmission lines to towers through binomial distribution. The second step calculates the damage probability of transmission towers. The aging effect uses two-parameter Weibull distribution to calculate the aging failure probability. The corrosion effect uses the uniform corrosion theory to calculate the corrosion failure probability. The guy wire reinforcement is realized by increasing the mean value of design wind load for strength curves. Next, this paper uses probability addition equation to integrate multi-effect and obtained the final damage prediction results. Finally, we used the 110-kV THJ (TieHaiJia) line in Guangdong province, China under Typhoon “Mangkhut” in 2018 as an example to check the accuracy of proposed method.
Results: The results show that the comprehensive failure probability is close to 1, and the reinforcement effect can only reduce the failure probability by 0.003.
Conclusion: It is concluded that considering the tower-line coupling effect to improve failure probability is closer to practice, but the reinforcement effect should not be blindly improved.
Keywords
Introduction
In recent years, typhoons have caused huge damage to coastal power system in China[1]. On the one hand, a typhoon may damage a large number of electrical equipment and cause difficulties for the stable and reliable operation in power sectors. On the other hand, it can result in power outage for many users and have a serious impact on industrial production and citizens’ lives. For the purpose of improving the ability to withstand risks in power system, there is a need to study the damage risk of transmission lines under typhoon disasters.
Some research has conducted damage risk prediction of transmission lines under typhoon disasters. Xue et al.[2] discussed failure rate model in the case of complex natural disasters and mass faults in power system. Yang et al.[3] proposed a technique for identifying weak links in power grids based on risk indicators under extreme ice disasters. They used strength-stress interference models to determine the failure probability of transmission lines and towers. Hou et al.[4] and Huang et al.[5] used physical models including stress-strength interference model and rigid body straight bar method to establish a risk prediction model for transmission lines under typhoon disasters. However, it is necessary to further consider the influencing factors such as microtopography. Zhang et al.[6] used non-linear stepwise regression method combined with back-propagation artificial neural network to predict the accident probability. They built an intelligent gale-induced transmission tower fault warning system. Hou et al.[7] analyzed microtopography, design data, etc. and used multi-factor correction methods to improve the prediction accuracy of reliability model. Hou et al.[8] used a mixture of Random Forest, Monte Carlo method and stress-strength interference model. The mixed model has higher prediction accuracy than a single model. However, existing research has paid little attention to tower-line coupling effect and the inevitable multi-effect of aging, corrosion and guy wire reinforcement in engineering practice, which leads to a large deviation between the predicted result and the actual situation.
In terms of the effect of tower-line coupling, the methods of finite element analysis (FEA) and wind tunnel test are mainly used at present. Qiang et al.[9] conducted wind tunnel tests on the aeroelastic model of UHV transmission tower line system. They studied the dynamic behavior of the tower-line system at different wind speeds. The dynamic behavior of the tower-line coupled system is more susceptible to wind speed than that of the single tower. Tian et al.[10] studied the wind-induced dynamic response of long-span transmission towers by establishing a wind tunnel test aeroelastic model of tower-line coupling system and summarized the effective solutions for modeling. Similarly, Wang et al.[11] also established an aeroelastic model of tower-line system and analyzed the power spectral density (PSD) under wind field with various directions and speeds. The results show that the coupling effect has a significant impact on the wind vibration effect. Xie et al.[12] analyzed the tower-line coupling effect through wind tunnel test and FEA of the tower-line system aeroelastic model. The results show that the tower-line PSD under high wind speeds had energy crossover and the coupling effect was greatly enhanced. They did not study the load transfer law of the tower-line system. Liang et al.[13] performed wind tunnel tests on boundary layer for tower-line coupling system and established an aeroelastic model. They investigated the wind-dependent vibrations of transmission towers with the effects of tower-line coupling. The results indicate that the influence of coupling effect on wind-induced responses of the tower must be considered in the windproof design. However, the current tower-line coupling mechanism lacks theoretical solutions, such as the internal mechanism of tower-line coupling effects and coupling forms. Existing research has only analyzed specific scenarios through methods such as wind tunnel tests and FEA. Although the experimental conclusions were accurate, the universality and applicability of these methods need to be discussed.
In terms of multi-source information modeling, current research mainly uses meteorological information, geographic information and vegetation information. Guikema et al.[14,15] used public data and statistical learning methods to realize power outage prediction and infrastructure risk assessment under hurricanes. Hou et al.[16] calculated the comprehensive damage probability of the transmission tower-line system considering both model-driven and data-driven approaches. The data-driven approach used Random Forest algorithm to consider a variety of factors to modify the model-driven probability. Hou et al.[17] used a variety of machine learning methods to establish a damage prediction model for transmission towers based on meteorological information, geographic information and equipment operating years and proved the superiority of combined methods. Therefore, studies have used multi-source information to improve the damage prediction accuracy, but they have seldom considered the aging effect of equipment, the corrosion effect of external environment and the influence of guy wire reinforcement related to human factors.
This paper proposes a method to predict the damage of transmission towers under typhoon disasters considering multi-effect. The highlights of this paper are:
We propose a theoretical solution to the tower-line coupling effect from the perspective of probability. Compared with wind tunnel experiment, the obtained probability is close to complete failure.
We consider the effects of aging, corrosion and guy wire reinforcement to improve calculation accuracy closer to the engineering practice.
We verify the significant contribution of the tower-line coupling effect to the comprehensive damage probability, and the improvement of reinforcement effect has little impact on reducing the former.
The rest of this paper is organized as follows. Section 2 uses a two-step reliability model to calculate the wind load of transmission lines. Section 3 discusses the damage calculation principles under three effects of corrosion, aging and guy wire reinforcement. Finally, in Section 4, we draw a conclusion.
Physical model for wind load of transmission lines
Figure 1 is the structure diagram of damage prediction method considering multi-effect. It shows the calculation principle in this and the next section. In Section 2, we first calculate the wind load of conductors and towers and calculate the failure probability of conductors through interference area method in structural reliability theory[18]. Then, we use binomial distribution to couple the wind load of conductors to towers and calculate the damage probability of towers. In Section 3, we use probability addition equation[19] to integrate multi-effect and tower-line coupling effect.
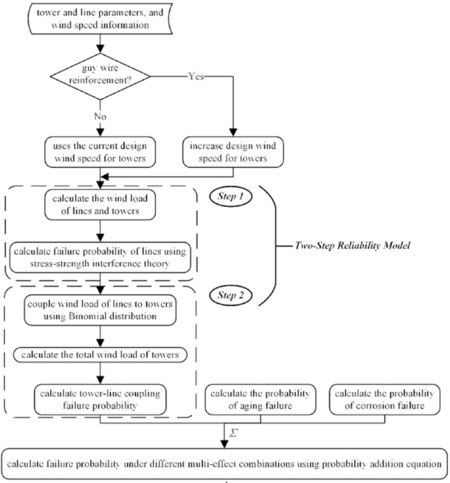
Figure 1. The structure diagram of damage prediction method considering multi-effect.
Wind load of conductors
According to the calculation method for wind load of conductors introduced in[20]:


where WX is the standard value of wind load on conductors or ground wires, kN. α is the coefficient of uneven wind pressure, which is determined according to Article 7.1.2 in[20]. μs is the coefficient of body shape factor of wind load; when d < 17 mm, it takes 1.2; when d ≥ 17 mm, it takes 1.1; and, when icing, it takes 1.2. μz is the height change coefficient of wind pressure; the base height is 10 m. d is the sum of calculated outer diameters of conductors or ground wires after icing, m. Lw is the horizontal span, m. Wo is the basic wind pressure, kN/m2. θ is the angle between the wind direction and the conductors or ground wires (°). V is the wind speed with a base height of 10 m, m/s.
Wind load of towers
When the wind direction is perpendicular to the tower surface, the standard value of the wind load on the tower body or cross-arm is calculated as:

where WS is the standard value of wind load on the tower body or cross-arm, kN. β is the adjustment coefficient of wind load on towers, which should be adopted in accordance with the relevant provisions of the current national standards[21]. A is the equivalent wind bearing area, m2.
Two-step reliability model under tower-line coupling effect
To couple the wind load of conductors and towers, this paper proposes a two-step reliability model. In the first step, we calculate the damage probability of conductors. After coupling the wind load on conductors to towers through binomial distribution, we calculate the damage probability of towers in the second step. Both steps use the stress-strength interference model[5].
In the actual wind load calculation, the sample with larger wind load should be selected, namely the extreme wind load[22]. We assume that the design strength of the equipment obeys normal distribution[23] and the wind load obeys extreme I-type distribution[24]. When the predicted wind speed sequence is available, we use the stress-strength interference model for calculation[5]. When only the maximum wind speed is available, we use the traditional reliability model for calculation.
This paper considers the conductors at both ends of an intermediate support are three-phase single circuit. It is assumed that the wind load of conductors obeys extreme I-type distribution and the probability density function is:

where a is the size parameter, a > 0. u is the position parameter, -∞ < u < ∞.
The stress of the towers and conductors obeys normal distribution:

where μWxs is the mean value of the stress intensity of the conductors or towers. δwxs = βμWxs is the standard deviation of the stress intensity of the conductors or towers. β is the coefficient of variation (COV).
We ignore the height difference of the three-phase conductors. According to stress-strength interference theory, the calculation parameters of three-phase conductors are the same, and the damage calculation results are also the same. After the first step, the failure probability of each phase conductor on one side of the tower is recorded as PABC and the equation is:

Assuming that the conductor failure has only two states, disconnection and normal, the corresponding wind load of conductors coupled to towers are o and WX, respectively. Therefore, the coupled wind load obeys binomial distribution and the expectation wind load of the conductor of phase A on one side of the tower is:

The expectation of resultant wind load of three-phase conductors on both sides of the tower is:

We decompose the wind load on towers along perpendicular and parallel directions to the lines:


In the perpendicular and parallel directions to the lines, the resultant wind load on towers can be written as:


In the perpendicular direction to towers, we use the stress-strength interference theory to obtain the failure probability PS┴ in the second step. The calculation principle is the same as (6).
Failure probability calculation considering multi-effect
Two-step reliability model under tower-line coupling effect
The failure law of electrical equipment aging with time follows the classic “bathtub curve”. The Weibull distribution can more comprehensively describe three stages of the “bathtub curve” and is widely used in reliability and lifetime analysis[25].
The lifetime distribution function of components based on Weibull distribution is:

The lifetime density function of components is:

Where α and β are the scale parameter and shape parameters of Weibull distribution, respectively. F(t) represents the failure probability of a tower before time t and can reflect the cumulative effect of failure probability over time. When β > 1 and f(t) > 0, the failure probability F(t) increases with time, which characterizes the aging of components.
Failure probability of towers considering corrosion effect
Wu et al.[26] pointed out there are two types of corrosion: uniform and non-uniform corrosion. Uniform corrosion occurs at a macroscopic uniform rate throughout the metal surface in contact with the external environment. The iron corrosion in the atmosphere is a typical uniform corrosion. Since the towers in the main network are made of steel and reinforced concrete, we assume that the tower corrosion is relatively uniform and establish a reliability model for tower damage. Ma et al.[27] showed that the corrosion depth of steel bars in a chloride ion environment obeys logarithmic normal distribution. When the uniform corrosion depth is less than the specified maximum allowable corrosion depth, the structure state is reliable. The reliability model of the cross-section of the uniformly corroded steel bar can be expressed as:

where x is the corrosion depth; lnX is the logarithm of corrosion depth statistics X, which is a random variable; mη is the mean value of lnx; and ση is the variance of lnx.
The expectation and variance of the uniform corrosion depth distribution are:


We assume the parameters of corrosion depth statistics X at time t1 are (μx*,δx*), and the observations of X, x1, x2, …, xn, are from the surface of n steel bars. These observations are used to calculate the COV δx and the corrosion speed r. The mean value and standard deviation of these observations are:


Assuming that the corrosion depth is proportional to time[28], the corrosion speed is:

Since the mean value of corrosion depth varies greatly with time, and COV does not vary much with time, COV δx is usually made constant.
The reliability at t2 is calculated as:

where xmax is the maximum allowable corrosion depth.
From the moment estimation method E(x) = x̄, D(x) = σx2, we get:


where the statistics (μx, δx) at time t2 are:


Considering the influence of guy wire reinforcement on tower strength
We assume that the tower strength obeys normal distribution and guy wire reinforcement affects the design wind speed of towers. When calculating the reliability of towers, the mean value of design wind load changes from μWxs before guy wire reinforcement to μ’Wxs after guy wire reinforcement.
Integration method of multi-effect
For any n events A1, A2, …, An, the probability of their sum event[19] is:

This paper uses the probability addition equation to integrate the aging failure probability, the corrosion failure probability, the tower-line coupling failure probability and the probability considering guy wire reinforcement to obtain the final damage probability.
Prediction results of failure probability considering multi-effect
Overview of typhoon “Mangkhut”
On the afternoon of 7 September 2018, No. 22 Typhoon “Mangkhut” was generated in the Northwest Pacific Ocean. After shifting into the northeastern corner of the South China Sea on the morning of 15 September, it suddenly shifted westward, hitting the Pearl River Delta head-on and seriously affecting Guangdong province. “Mangkhut” had the widest impact area on land, the longest impact time of strong wind and the maximum gust speed among all typhoons that have landed in Guangdong province in history[29]. This case studied selected the 110-kV THJ line, a typical line with a running time of 12 years. Figure 2 shows the typhoon path and the location of the THJ line.
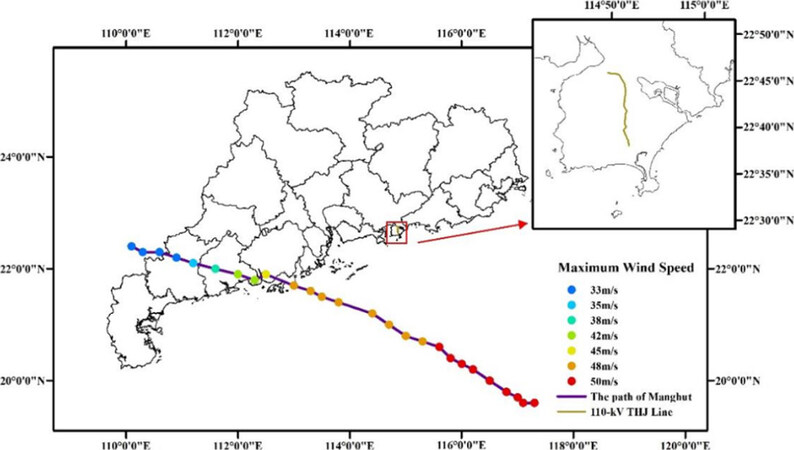
Figure 2. The track of strong typhoon “Mangkhut” and distribution of THJ line.
The typhoon caused 56 trips on 500-kV lines, 132 trips on 220-kV lines and 121 power outages on 110-kV lines, totalling 390 trips. There were 69,000 courts and 4.591 million users affected. After preliminary investigation and verification, the economic loss was 347 million yuan[30].
Prediction result
When calculating wind load, the uneven coefficient of wind pressure takes 0.75; the adjustment coefficient of wind load on towers is 1; the windward area of towers is 5 m2; the outer diameter of lines is 0.0096 m; the span is 250 m. The height variation coefficient of wind pressure is 1; and the shape coefficient of wind load is 1.2. Both two-step reliability calculations use the 3-s average instantaneous wind speed, which makes the predicted results more conservative and is conducive to more comprehensive prevention work.
The mean value of the uniform corrosion depth distribution is 2.7143 mm and the standard deviation is 2.0267 mm. The design wind speed of the equipment after guy wire reinforcement increases from 35 to 40 m/s. The aging parameters are α = 48.002 and β = 3.458.
Table 1 shows the damage probability under 10 conditions, including a basic damage probability P1 of tower-only and nine kinds of multi-effect combinations. We define that the comprehensive damage probability is calculated under the effects of corrosion and aging. The tower-line coupling damage probability is P2. The damage probability of the tower after guy wire reinforcement is P3. The tower-line coupling damage probability after guy wire reinforcement is P4. The aging failure probability of equipment is P5. The corrosion failure probability of equipment is P6. The comprehensive damage probability of the tower is P7. The comprehensive tower-line coupling damage probability is P8. The comprehensive damage probability of the tower after guy wire reinforcement is P9. The comprehensive tower-line coupling damage probability after guy wire reinforcement is P10.
Probability definition considering multi-effect
| Multi-effect | Reinforcement effect | Tower-line coupling effect | Aging effect (P5) | Corrosion effect (P6) | |
|---|---|---|---|---|---|
| Reinforcement effect | P3 | P10 | |||
| P4 | P9 | ||||
| Tower-line coupling effect | P10 | P4 | P2 | P8 | |
| Aging effect (P5) | P9 | P8 | P7 | ||
| Corrosion effect (P6) | |||||
Figure 3 shows the trend of predicted damage probability from 61 towers of THJ line under typhoon “Mangkhut”, while Supplementary Table 2 shows the specific damage probability value.
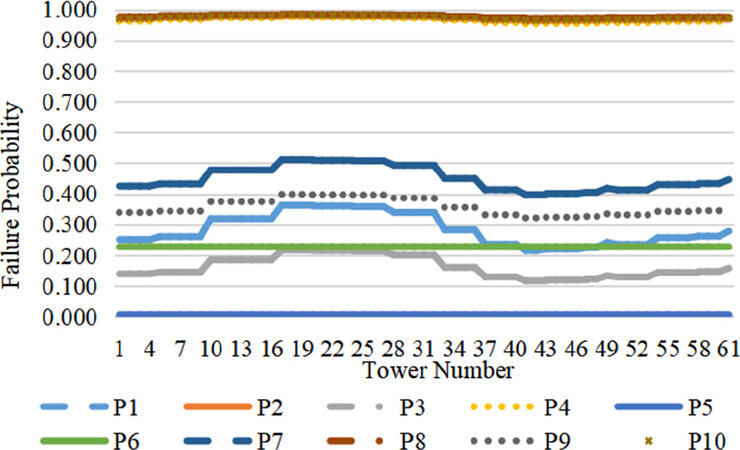
Figure 3. Damage probability of THJ line in 10 cases.
Supplementary Table 2 shows that, when tower-line coupling, corrosion and aging effects are not considered, the maximum damage probability of towers is only P1max = 0.363. When tower-line coupling effect is added, the maximum is P2max = 0.979, indicating that tower-line coupling effect makes a significant contribution to the comprehensive damage probability. When only the guy wire reinforcement is considered, the maximum damage probability of towers is reduced to P3max = 0.217, which is significantly lower than the case without guy wire reinforcement. After guy wire reinforcement, the maximum tower-line coupling damage probability is reduced to P4max = 0.975. Therefore, guy wire reinforcement also has a certain effect, but it is not significant. The tower-line coupling effect plays an important role in the damage of transmission equipment under typhoon disasters.
The failure probability of equipment aging is only P5 = 0.006, indicating that the 12-year operating time has little contribution to the damage probability of the equipment. The failure probability of equipment corrosion is P6 = 0.228, indicating that the corrosion effect has a greater contribution to equipment damage. Considering the effects of aging and corrosion, the maximum comprehensive damage probability of towers is P7max = 0.511, which is significantly higher than P1max = 0.363. Thus, the aging and corrosion effects should be considered in actual calculations.
Considering the tower-line coupling, aging and corrosion effects, the maximum comprehensive damage probability is P8max = 0.984. It is the highest among all the probabilities, indicating that all the considered effects contribute to the damage probability. The maximum comprehensive damage probability of towers after guy wire reinforcement is reduced to P9max = 0.399. It is lower than P7max = 0.511 when towers are not reinforced. However, the maximum comprehensive tower-line coupling damage probability after guy wire reinforcement is P10max = 0.981, which is not significantly lower than P8max = 0.984 without guy wire reinforcement. Meanwhile, Figure 3 shows that the calculation results of these conditions have roughly the same trend. Towers 10-36 have a relatively high damage probability. This feature is more advantageous for the damage analysis of the same line. However, when the prediction results are applied to the entire network, we need a unified damage probability threshold to judge the damage state, so we should comprehensively consider the tower-line coupling, aging and corrosion effects and the influence of guy wire reinforcement.
Figure 4 shows the four cases with the highest damage probability, namely the tower-line coupling damage probability P2, the tower-line coupling damage probability P4 after guy wire reinforcement, the comprehensive tower-line coupling damage probability P8 and the comprehensive tower-line coupling damage probability P10 after guy wire reinforcement. The tower-line coupling effect significantly increases the damage probability of transmission lines. At the same time, P4 is lower than P2, while P10 is lower than P8. Thus, the guy wire reinforcement has a certain effect on restraining the coupling effect.
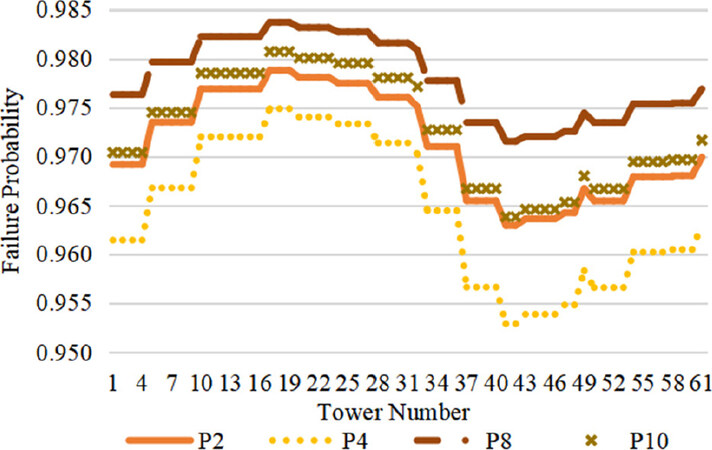
Figure 4. Four cases with the highest damage probability of THJ line.
Figure 5 shows the damage probability without considering the tower-line coupling effect. It can be seen that the comprehensive damage probability P7 of the tower is the highest, indicating that aging and corrosion contribute significantly to the tower damage. At the same time, the failure probability P5 of equipment aging and the failure probability P6 of equipment corrosion are almost constant. The reason is that both are related to time and the operating years are not much different. The damage probability P3 of towers after guy wire reinforcement is lower than P1 without guy wire reinforcement, and the comprehensive damage probability P9 of towers after guy wire reinforcement is also lower than P7 without guy wire reinforcement, indicating that guy wire reinforcement has an effect on reducing the damage probability.
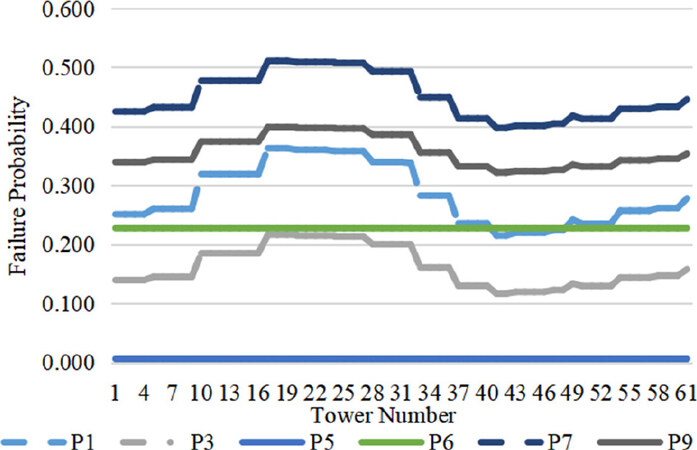
Figure 5. Failure probability without considering the tower-line coupling effect.
In summary, the tower-line coupling effect occupies a dominant position in the contribution of tower damage and should be considered in engineering practice.
As shown in Figure 3, we found that the damage probability of Towers 17-27 is significantly higher than the others. The main reasons are the high wind speed acting on the tower and the significant tower-line coupling effect, followed by the corrosion and aging effects. The towers actually damaged during the typhoon were Towers 19-21, and the damage reason for Tower 19 was the corrosion of the anchor rod, which broke down under the wind load. Therefore, the prediction result can reflect the real damage situation, which proves the scientific nature of the method in this paper.
Conclusions
This study took the wind load model of transmission conductors and towers as the research object and simulated the tower-line coupling effect through the two-step reliability model. This model can reflect the physical essence of tower-line coupling effect in principle. This paper establishes an aging failure model based on two-parameter Weibull distribution, a corrosion failure model based on uniform corrosion theory and a guy wire reinforcement model based on reliability theory. Finally, this paper uses probability addition equation to integrate multi-effect and establishes a damage prediction model for transmission lines under typhoon disasters. The prediction model was verified by taking the 110-kV THJ line, a typical line in Guangdong province, China, under Typhoon “Mangkhut” in 2018, as an example.
However, this paper buildes the damage prediction model of transmission tower-line system considering multi-effect under typhoon disasters only through the physical strength-stress interference model and does not use data mining or intelligent algorithms to analyze historical data for probability prediction. In addition, since the reinforcement effect does not significantly inhibit the tower-line coupling effect, this paper does not explore the design wind speed standard that should be achieved after guy wire reinforcement. The results show that tower-line coupling effects, aging effects, corrosion effects and the influence of guy wire reinforcement play important roles in the failure probability calculation of transmission equipment under typhoon disasters. The method with four effects considered can effectively improve the prediction accuracy.
Declarations
AcknowledgmentsThe measurement and recording of the experimental data in this paper was done with the strong support of the staff from Electric Power Research Institute of Guangdong Power Grid Co., Ltd., and I would like to express my heartfelt thanks to them.
Authors’ contributionsFunding acquisition, project administration, provide research resources, and supervision: Hou H
Methodology, software, and writing-review editing: Zhang Z
Data process, investigation, Methodology, software, visualization and writing-original draft: Yu S
Conceptualization, data acquisition, project supervision, and validation: Huang Y
Writing-review editing: Hou H, Zhang Y, Dong Z
Availability of data and materialsThe data is obtained from Guangdong Electric Power Research Institute, the author will not be shared and explain it.
Financial support and sponsorshipThis work is supported by University-Industry Collaborative Education Program of Ministry of Education of the People’s Republic of China (201902056044).
Conflicts of interestAll authors declared that there are no conflicts of interest.
Ethical approval and consent to participateNot applicable.
Copyright© The Author(s) 2021.
REFERENCES
1. Yang Y, Tang W, Liu Y, Xin Y, Wu Q. Quantitative resilience assessment for power transmission systems under typhoon weather. IEEE Access 2018;6:40747-56.
2. Xue Y, Wu Y, Xie Y, Yue D, Lin Z, Wen F. Power system stability analysis for intercurrent natural disasters. Automation of Electric Power Systems 2016;40:10-8.
3. Yang Y, Zhou X, Lu J, Xie X, Bu C. Research on identification technology of weak links in power grid based on risk index under extreme ice disaster. In: Xue Y, Zheng Y, editors. Proceedings of 2020 International Top-Level Forum on Engineering Science and Technology Development Strategy and The 5th Purple Mountain Forum (PMF2020) Nanjing, China. Singapore: Springer; 2020.
4. Hou H, Yu J, Huang Y, et al. Risk assessment of windage yaw trip of transmission lines under the attack of typhoon. High Voltage Engineering 2019;45:3907-15.
5. Huang Y, Wei R, Zhou E, et al. Early warning method of transmission line damage under typhoon disaster. Automation of Electric Power Systems 2018;42:142-50.
6. Zhang N, Wang H, Liu Y, Liu J, Zhang L. The intelligent early warning system for the gale-induced transmission tower fault probability. In: Xue Y, Zheng Y, editors. Proceedings of Purple Mountain Forum 2019-International Forum on Smart Grid Protection and Control Nanjing, China. Singapore: Springer; 2019.
7. Hou H, Geng H, Huang Y, Wang H, Li X, Wu X. Multi-factor correction based failure prediction method of transmission line with typhoon disaster. Automation of Electric Power Systems 2019;43:193-201.
8. Hou H, Yu S, Wang H, Xu Y, Wu X. A hybrid prediction model for damage warning of power transmission line under typhoon disaster. IEEE Access 2020;8:85038-50.
9. Qiang X, Cai Y, Xue S. Wind-induced vibration of UHV transmission tower line system: wind tunnel test on aero-elastic model. Journal of Wind Engineering and Industrial Aerodynamics 2017;171:219-29.
10. Tian L, Wang W, Zeng Y, Li T. Design of an aero-elastic model of long span transmission tower-line system in wind tunnel. Industrial Construction 2017;47:74-8.
11. Wang W, Sun Z, Zeng Y, Li T. Wind tunnel test on wind-induced vibration response of long-span transmission tower-line system. Industrial Construction 2017;47:79-84.
12. Xie Q, Yang J. Wind tunnel test and numerical simulation on transmission tower-line coupling system. Power System Technology 2013;37:1237-43.
13. Liang S, Zou L, Wang D, Hong C. Investigation on wind tunnel tests of a full aeroelastic model of electrical transmission tower-line system. Engineering Structures 2015;85:63-72.
14. Guikema SD, Nateghi R, Quiring SM, Staid A, Reilly AC, Gao M. Predicting hurricane power outages to support storm response planning. IEEE Access 2014;2:1364-73.
15. Guikema SD, Quiring SM. Hybrid data mining-regression for infrastructure risk assessment based on zero-inflated data. Reliability Engineering and System Safety 2011;99:178-82.
16. Hou H, Geng H, Huang Y, Wu H, Wu X, Yu S. Damage probability assessment of transmission line-tower system under typhoon disaster, based on model-driven and data-driven views. Energies 2019;12:1447.
17. Hou H, Yu S, Xiao X, Huang Y, Geng H, Yu J. Risk assessment of transmission tower in typhoon based on spatial multi-source heterogeneous data. Automation of Electric Power Systems 2020;44:127-37.
18. He S, Wang S. Structural reliability analysis and design. Beijing: National Defence Industrial Press; 1993.
19. Larsen R, Marx M. An introduction to mathematical statistics. Prentice Hall; 2005.
20. Code for design of 110kV 750kV overhead transmission line; 2010. Available from https://www.codeofchina.com/standard/GB50545-2010.html [Last accessed on 13 May 2021].
21. Load code for the design of building structures; 2012. Available from: https://www.codeofchina.com/standard/GB50009-2012.html [Last accessed on 13 May 2021].
22. . Wang Y. The dynamic reliability of transmission tower system under the wind load. Dalian University of Technology; 2008. Available from: https://kns.cnki.net/kcms/detail/detail.aspx?dbcode=CMFD&dbname=CMFD2009&filename=2009041095.nh&v=bx5Qi%25mmd2BSQ2bA65hUny5MkIoYO6KbDd900dPD%25mmd2BTk9Srl%25mmd2BQo9zOo59c96TuPcY2%25mmd2Fx36 [Last accessed on 13 May 2021]
23. . Lan Y. Distribution system reliability evaluation and design considering influence of typhoon. Chongqing University; 2014. Available from: https://kns.cnki.net/kcms/detail/detail.aspx?dbcode=CMFD&dbname=CMFD201501&filename=1014042969.nh&v=QiBTHBfO0NLaafLAzMDLdhcBL2yREUnGPjbcYouz6P5gREpLFHDiKxYzL4Q4GvGP [Last accessed on 13 May 2021]
25. . Zeng C. The optimization study of periodic maintenance cycle of big-scale centrifugal compressor. Harbin Institute of Technology; 2008. Available from: https://kns.cnki.net/kcms/detail/detail.aspx?dbcode=CMFD&dbname=CMFD2011&filename=2009292037.nh&v=WkgGwIZPlUD4E4mz0Bwv3%25mmd2FuXo9b2v7oJ8v8IDFFueQllMdqcK%25mmd2F%25mmd2BWKPVEDKjWRSQk [Last accessed on 13 May 2021]
26. Wu M, Zhao Y. Handbook of materials testing for mechanical engineering. Shenyang: Liaoning Science and Technology Publishing House; 2002.
27. Ma YL, Li R. Reliability Analysis of General Corrosion of Rebar Steel. Corrosion & Protection 2012;33:702-4.
28. Wang Q, Wang W. Reliability design of common mechanical parts. Beijing: Mechanical Industry Press; 1996.
29. Meteorological Analysis Report of Typhoon “Mangkhut”. Electric Power Research Institute of Guangdong Power Grid Co., Ltd.; 2018. Available from: https://www.hko.gov.hk/en/informtc/mangkhut18/report.html [Last accessed on 13 May 2021].
30. Meteorological Analysis Report on the Damage of Transmission Equipment Caused by Typhoon “Hato”. Electric Power Research Institute, Guangdong Power Grid Co., Ltd.; 2017.
Cite This Article
Export citation file: BibTeX | RIS
OAE Style
Hou H, Zhang Z, Yu S, Huang Y, Zhang Y, Dong Z. Damage prediction of transmission lines under typhoon disasters considering multi-effect. J Smart Environ Green Comput 2021;1:90-102. http://dx.doi.org/10.20517/jsegc.2020.04
AMA Style
Hou H, Zhang Z, Yu S, Huang Y, Zhang Y, Dong Z. Damage prediction of transmission lines under typhoon disasters considering multi-effect. Journal of Smart Environments and Green Computing. 2021; 1(2): 90-102. http://dx.doi.org/10.20517/jsegc.2020.04
Chicago/Turabian Style
Hou, Hui, Zhiwei Zhang, Shiwen Yu, Yong Huang, Yongxi Zhang, Zhaoyang Dong. 2021. "Damage prediction of transmission lines under typhoon disasters considering multi-effect" Journal of Smart Environments and Green Computing. 1, no.2: 90-102. http://dx.doi.org/10.20517/jsegc.2020.04
ACS Style
Hou, H.; Zhang Z.; Yu S.; Huang Y.; Zhang Y.; Dong Z. Damage prediction of transmission lines under typhoon disasters considering multi-effect. . J. Smart. Environ. Green. Comput. 2021, 1, 90-102. http://dx.doi.org/10.20517/jsegc.2020.04
About This Article
Copyright

Data & Comments
Data


 Cite This Article 13 clicks

 Like This Article 23
likes
Like This Article 23
likes


Comments
Comments must be written in English. Spam, offensive content, impersonation, and private information will not be permitted. If any comment is reported and identified as inappropriate content by OAE staff, the comment will be removed without notice. If you have any queries or need any help, please contact us at support@oaepublish.com.