
Trends summarization of times series: a multi-objective genetic algorithm-based model

Abstract
Aim: The explosion of the amounts of data generated in many application domains, makes the paradigm of data summarization more essential. Furthermore, it is of a great interest to effectively handle some specific needs. In this work, we discuss an advanced model to drive linguistic summarization in the context of time series. This model relies on a multi-objective genetic algorithm mechanism to generate a set of best summaries from a large number of candidates.
Methods: To achieve this objective, the current work is divided into two parts: The first part is dedicated for extracting the linguistic summaries of the dynamic characteristics of the trends of time series. It is achieved using the traditional genetic algorithm where the fitness function represents the truth degree of the linguistic quantified proposition. The second part is devoted to formalise the problem of interest as a multi-criteria optimization problem. We use different quality measures of summary as targets for improving the predicted set of summaries. To reach this goal, we use the Fast Non-Dominated Sorting Genetic Algorithm NSGA-II.
Results: We evaluate the proposed approach on real data from a Smart Campus application (Neocampus project of the University of Toulouse, France). The results are promising and confirming the usability of the proposed approach.
Conclusion: The proposed approach overcomes the problem of the overabundance of irrelevant linguistic summaries of the time series. It allows selecting a set of best summaries regarding some relevant criteria.
Keywords
INTRODUCTION
The need for an effective method to both reduce the volume of data and to extract useful knowledge is becoming more significant. Specifically, with the explosion in the amount of data generated in many areas, such as sensor networks and IoT platforms. Following this approach, data processing can be less time-consuming. At the same time, it can solve or mitigate energy-efficiency and performance related issues. To this end, data reduction seems useful and practical in application areas where approximate answers and data tendencies are suitable for decision-making. Summarization is a convenient method to reduce a large set of data and derive the most relevant information. Among the most recent works, the comprehensive survey proposed in [1] is considered. It provides an overview of data summarization techniques, such as clustering, sampling, and histograms. As pointed out by [2], data summarization is a procedure of creating a compact, yet informative version of the original data. As discussed by [3], the summarization was considered as one of the key skills now required for any intelligent system aimed to operate in real-life.
It is worthy to note that most common methods used to summarize the data are not intelligent enough and not human consistent [4], due to the little use of the natural language. Statistical summarization is generally understandable for users having a sufficient level of statistical literacy, which is not always the case (e.g., domain experts) [5]. This fact motivated many researchers to propose several approaches relying on natural language concepts to derive summaries from large datasets which is also known as fuzzy linguistic summaries [4, 6]. In this work, we are not only dealing with large volume of data that is beyond human cognitive and comprehension skills. However, we also tackle data with temporal specificity so called time series. Due to the main role played by the time in the real life situations; the time series have been a subject of intensive research [7-14]. For instance, Kacprzyk et al. [10, 11] propose to use the basic linguistic summarization process to summarize the trends of the time series. This technique produces a large number of irrelevant summaries that could be seen as an optimization problem. Thus, we seek to select a set of best summaries among a large set of candidates.
In this work, we aim to address the issue of selecting a set of best summaries of time series. To achieve this goal, we propose to linguistically summarize the dynamic characteristics of trends that identify the time series using genetic algorithm. This is our first contribution where the fitness function represents the truth degree based on Zadeh's calculus of linguistically quantified propositions [15]. Then, to optimize the different measures of summary quality, we propose to use the Fast Non-Dominated Sorting Genetic Algorithm NSGA-II introduced in [16]. We validate our proposal by conducting a set of experiments on real data collected from the multiple sensors installed in the smart campus, Neocampus, which is a project at the university of Toulouse III, France [17].
The remainder of paper is organized as follows: in Section 2, we briefly discuss the basic concepts of the linguistic data summarization and recall the different measures of quality. In parallel to that, Section 3 explains how to extract trends from time series and describes the dynamic characteristics of the considered trends. Section 5 provides a review on the main existing studies related to our current work. On the other hand, Section 6 is devoted to our model to select the best summaries of trends of time series. First, it addresses the use of a single-objective genetic algorithm and then a multi-objective genetic algorithm. Additionally, preliminary experimental results are discussed as well. In Section 7, we conclude and outline some future work.
FUZZY LINGUISTIC SUMMARIZATION
The linguistic data summarization introduced in [18] can been seen as a concise, efficient, and human consistent version of a dataset that allows knowledge extraction. The main idea is to generate a statement in a natural language, such as "Most of young employees are well paid". We consider the quantified propositions in the general form "Q y are S" or "Q R y are S". In the following, we use the source terminologies [19, 20] and we explain the components of the summary and its measures of propriety.
Assume that we have a dataset where:
Summary structure
According to the aforementioned protoforms, the linguistic summary consists of the following components:
It should be noted that in Equation (3) and in addition to the min operator, another t-norm operator can be used, too. For instance, this is desirable when the idempotency property is required but not downward reinforcement.
The authors in [4, 19, 21] consider the truth degree as the primary criterion to evaluate the summary and measure its propriety and appropriateness. However, this measure does not cover all the aspects of the summary, which urged the researchers to propose other validity criteria discussed in the sequel.
Other Validity Criteria
● Degree of imprecision: constructed as the size of the support of the membership function compared to that of the universe on which it was defined.
Let us assume that the dataset is represented by various attributes, i.e.,
Where card represents the cardinality of the corresponding (non-fuzzy) set. The degree of imprecision is defined as indicated in Equation (5), it should be noted that this degree depends only on the form of the summary.
● Degree of covering: indicates how many objects in the dataset, corresponding to the qualifier R, are "covered" by the particular summarizer
where
● Degree of appropriateness: quantifies the extent to which a summary is "surprising"; its value is high when two variables (attributes) are dependent.
and
where
The degree of appropriateness can be defined as
For more details regarding these measures, please refer to [4].
LINGUISTIC SUMMARIZATION OF TIMESERIES
In this section, we address the time series summarization using fuzzy linguistic quantifiers. Time series can be defined as sequences of numerical data associated with time indices as given in Equation (10).
To summarize the time series, linguistically, one way is to generate the summarization of the dynamic characteristics of the trends identified with straight line segments of piece wise linear approximation of the time series, such as the dynamic of change, duration and variability. In our previous work [22], we have suggested to use the algorithm bottom-up to generate trends due to the simplicity of understanding and implementation of the mentioned algorithm. In this section, we discuss this algorithm and we present the dynamic characteristics of trends.
Time series segmentation: bottom-up algorithm
The key idea of the algorithm is to divide the time series into a large number of segments with equal lengths. Then, each pair of consecutive segments is compared. The pairs causing the smallest increase in the error are identified, and consequently merged in one new bigger segment. The algorithm repeats these steps until all the segments have errors below a given threshold. The main steps to segment the time series is described in Algorithm 1.
Algorithm 1: Bottom-up algorithm Input: T // time series
Result: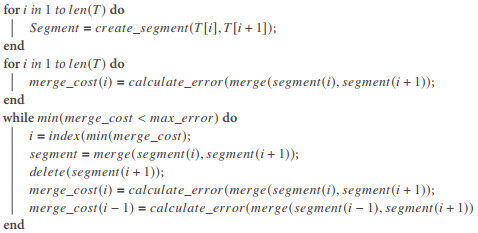
Trend's characteristics
To describe the obtained trends, we propose to associate them with three variables: dynamics of change, duration, and variability. In the following paragraphs, these aspects are illustrated in detail.
The range of possible slopes
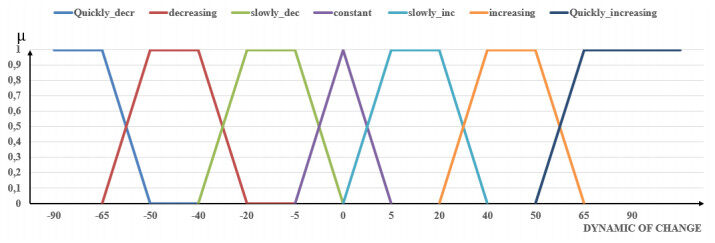
Figure 1. Fuzzy sets characterizing the dynamics of change.
● The Range represents the foremost direct measure of the variability and understandability. The range of a given dataset is the calculation of the difference between the upper and lower values in the dataset, thus it is highly susceptible to outliers.
● The Interquartile Range (IQR) alludes to the center half of the dataset that is between the upper and the lower quartiles. Specifically, it incorporates 50
● The Variance describes the average squared difference of the values from the mean. Unlike the previous measures of the variability, the variance incorporates all the dataset in the computing, by comparing each value to the mean.
● The standard deviation refers to the typical standard difference between each value and the mean.
In our experimentation, we intend to utilize the IQR to describe the variability for different reasons, such as the resistance to outliers and the simplicity of its calculation.
We compute the interquartile of the data covered by each trend. This measure is considered as a linguistic variable associated with three linguistic labels, namely low, moderate, and high.
GENETIC ALGORITHMS PRINCIPLE
In this section genetic algorithm concept is introduced. At the same time, the aim behind utilizing multi-objective genetic algorithm, more precisely the Non-Dominated Sorting Genetic algorithm NSGA-II is address, too.
Genetic algorithm (GA) introduced in [23] is an evolutionary algorithm that uses the concept of the natural selection in order to get the best solution for a given problem; it is inspired by biology mechanisms. The main idea of the algorithm is to generate a random population of individuals or chromosomes. Each individual has a set of proprieties called genes representing a solution for the considered problem. To evaluate the candidate solution, is is associated to a fitness function that determines which chromosome will be selected for the next generation.
The new generation of the population is produced using simple evolutionary operators: selection, crossover, and mutation. The selection (or reproduction operator) is a process based on the fitness function that indicates the individuals who will participate in the creation of the new generation. The crossover operator is a process that combines the genes of two individuals, called parents, to produce an offspring carried some genes from both parents. The mutation operator allows randomly changing the alleles in each chromosome.
A set of parameters is used to design the genetic algorithm model, namely the population size, the probability of the mutation, and the probability of crossover. In addition to the aforementioned parameters, it is necessary to choose carefully, according to the problem, the following three elements: representation of chromosome, the method of selection (e.g., roulette wheel selection, elitist selection, and rank selection), and crossover (e.g., single point crossover, double point crossover, and uniform crossover). The basic operator steps of a genetic algorithm are depicted in Algorithm 2 (for more details, please refer to [23]).
Algorithm 2: Genetic algorithm principle 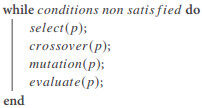
Motivation
Over the past few years, several works dealing with the genetic algorithm have focused on the multi-objective aspect. In real-life situations, optimization issues like conflicting objectives, such as increasing the performance and reducing the cost[24] are widely encountered. Improving one particular objective may lead to unacceptable values for the other objective. The appropriate solution is to have a compromise between the objectives, which means finding a solution that satisfies the objectives at an acceptable level without being dominated by any other solutions. Genetic algorithm can be utilized to handle multi-objective optimization problems. Several models of the multi-objective genetic algorithm have been studied in the literature. In the next subsection, we discuss the Fast Non-Dominated Sorting Genetic Algorithm NSGA-II.
Fast Non-Dominated Sorting Genetic Algorithm NSGA-II
NSGA-II is one of the most well-known multi-objective genetic algorithms proposed by [16]. It exploits the notion of Pareto dominance1 to classify solutions and define selection strategies (i.e., reproduction or survival). In general, it is considered as an elitist algorithm. It keeps the best solutions in the population over generations; these solutions participate in the reproduction process. However, the number of non-dominated solutions can grow rapidly for problems with several objectives.
1 Let
To overcome this problem, NSGA-II uses a mechanism for preserving the diversity. In each generation, the populations of parents and children are merged and classified into several Pareto fronts (a front of Pareto is the set of solutions that are not dominated, in Pareto sense, by any other solution). The population of the next generation is formed by choosing solutions from these Pareto fronts, starting with the first one. If the size of the front, to be used, is greater than the number of places remaining to see in the future population, the solutions are chosen according to their crowding distance value. This is an indicator that calculates the average distance, over all of the objectives, between a given solution and its direct neighbors in the results space (i.e., the objectives space) as illustrated in Equation (14), where N indicates the size of the population and M denotes the number of the objectives represented by
RELATED WORK
In this section, the main works related to three sides of linguistic summarization are discussed. Firstly, we present the general linguistic summarization approaches. Secondly, we give an overview of temporal data summarization and the techniques for generating trends of time series. Thirdly, we highlight the use of the genetic algorithm paradigm to extract the set of best summaries.
For a long time, the linguistic data summarization attracted the researchers, due to the use of natural language which allows extracting the knowledge from a large database in an efficient and effective manner emulating the human estimation and viewpoint. One of the first works was [18] which proposed to use a linguistic quantified proposition in the sense of Zadeh [25]. This concept was considerably developed in [6, 19, 26, 27]. The main idea is to represent data as a set of sentences, in the natural language, where each sentence represents an instance from the general protoforms "Q y are/have S" or "Q R y are/have S" where Q is a linguistic quantifier, S and R are fuzzy labels which represent the target attributes. For example, "most trends are short" for the first protoform and "most short trends have low variability" for the second one [4, 9]. In our previous work [22], we compared two approaches used to produce summaries from a large database. The first one is based on linguistic quantifiers in the sense of Yager [18] and the second one emanates from the idea of typical value of a large database.
Nowadays, the time dimension plays a crucial role, thus it is presented in the major applications in the real-life. For this reason, researchers have given a particular importance to the data which have this temporal specificity called time series. To describe the time series, [7] proposes to summarize the proprieties of time series over hierarchical time intervals. In other works [8, 28], researchers suggested protoforms, such as "during the last 30 minutes, the temperature was high", which allows the study of both the occurrence or the duration of a phenomenon in the time series. At the same time, according to [9, 11], time series summarization refers to summarize the dynamic characteristics of trends associated to the time series. These trends are identified with straight-line segments of piece wise linear approximation of the time series using the Sklansky and Gonzalez algorithm discussed in [29]. However, various approaches have been proposed to extract trends. The widely known approaches, such as bottom-up, top-down, and sliding windows, are discussed in [12, 13, 14]. In our previous work [30], we discussed the use of the bottom-up algorithm to identify the time series trends. At the same time, we addressed the generated summaries from these trends.
The process of deriving summaries can be seen as an optimization problem in which it determines and selects the set of best solutions among a large number of candidates. In the literature, several meta heuristics theories and ideas have been proposed to improve the solution of the optimization problem. In the linguistic summarization context, the researchers are focused on the use of the genetic algorithms. Among the first works where the authors derived summaries is [31]; each summary is regarded as a chromosome and the truth degree is considered as a fitness function to evaluate the chromosome. In parallel to this, other works [32, 33] aimed to extract the linguistic summaries on dataset representing patients inflow, along a given year, where they defined each summary as a gene. This concept is also applied in [34, 35]. Furthermore, [36] introduces two particular operators, namely cleaning and propositions improve to ensure the diversity and the quality of the production of summaries.
OUR MODEL OF TRENDS SUMMARIZATION
In this work, we use the algorithm bottom-up explained in our previous work [30] to segment time series and to generate trends. The experiments are carried out on real data collected from multiple sensors (e.g.,
The obtained trends are associated with a set of variables which are dynamics of change, variability, and duration. The results of this segmentation are shown in Figure 2.
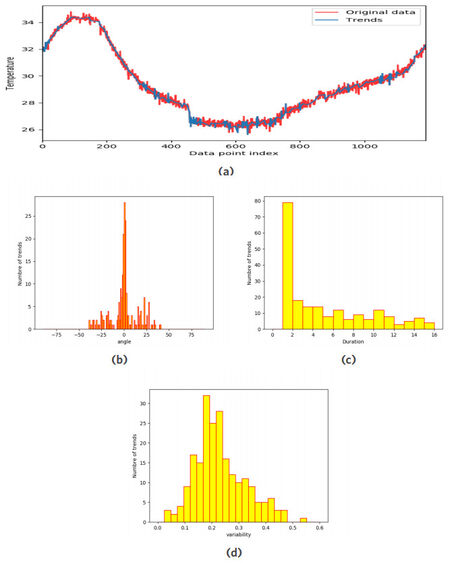
Figure 2. Dynamic characteristics of trends (a) trends of time series (b) dynamics of change (c) duration of trends (d) variability of trends.
We deal with only two characteristics of trends i.e., the duration and the variability. Each feature is described using a set of linguistics values as follow:
● The duration can be characterized by three values i.e., short, average, and long.
● The variability can be also described by three labels i.e., low, moderate, and high.
● For the quantity in agreement, three fuzzy relative quantifiers can be used i.e., few, around half, and most.
Our first contribution is to create a set of best summaries in the second protoform "Q R y are S", using the genetic algorithm with the traditional operators discussed in the previous section. To do that, each summary, which represents an individual, is coded in a binary form where the length of this individual (i.e., length of chromosome) is 8 bits as depicted in Figure 3. For example, the summary "most short trends have low variability" can be coded as
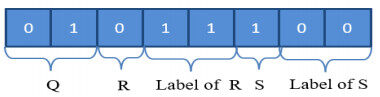
Figure 3. Example of an individual.
Basically, the initial population is generated randomly. At the same time, the fitness function associated to an individual is calculated using Equation (3). To select the individuals who will contribute in the generation of the new population, we apply the method of roulette wheel selection, where the fitness value is used to associate a probability of selection to each individual. The probability of being selected, for an individual
It should be noted that the single point crossover operator is applied to produce the offspring. At the same time, the crossover point is chosen randomly. An example of a single point crossover is illustrated in Figure 4.
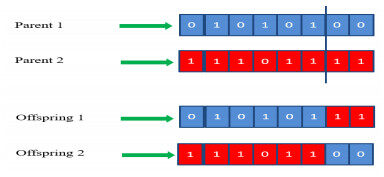
Figure 4. Single point crossover example.
Afterwards, the two generated offspring, as results of crossover, are mutated according to the parameter of mutation rate Figure5. Until the satisfaction of the final criteria proposed by the user, this procedure is repeated. Noting that the maximum number of iterations was used as a criterion in this context.
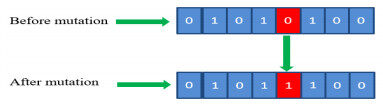
Figure 5. Mutation example.
The variation of the execution time, according to the model parameters, is illustrated in Figure 6. The effect of the variation in the number of iterations on the execution time, by fixing the mutation rate, is shown Figure 6a. Similarly, the variation in execution time as a function of change in the mutation rate is represented in Figure 6b. Additionally, the evolution of the best fitness function, through the generations, is demonstrated in Figure 6c.
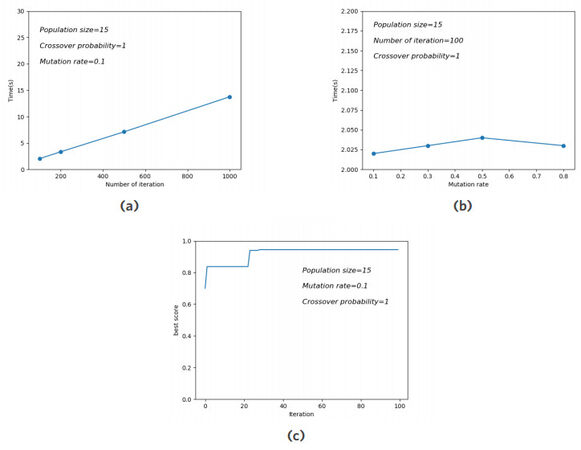
Figure 6. The evolution of the genetic algorithm. (a) Execution time according to the number of iterations; (b) Execution time according to the mutation rate; (c) the success rate versus the number of iterations.
Now, we supply the set of the best seven summaries in Table 1. The truth degree criterion, was obtained with the following parameters: the mutation rate = 0.1, the population size = 15, and the max number of iterations = 100.
Linguistic summaries obtained using genetic algorithm.
| Summary | Truth degree |
| Around half trends with moderate variability are short | 0.944 |
| Around half average trends have high variability | 0.939 |
| Around half long trends have high variability | 0.873 |
| Around half trends with high variability are short | 0.837 |
| Most average trends have moderate variability | 0.753 |
| Most average trends have moderate variability | 0.704 |
| Most trends with low variability are short | 0.7 |
It is clear that the truth degree is the most important criterion used to evaluate the summary. For this reason, we use the genetic algorithm to choose the set of best summaries. However, there are multiple criteria used to describe the appropriateness of the summary as explained in the previous section. Thus, this is what motivated us to utilize the multi-objective genetic algorithm NSGA-II. In addition to traditional operations, NSGA-II uses the notion of non-dominance to select the individuals participating in the creation of the new generation. If the number of individuals, in the Pareto front, exceeds the size of the initial population, NSGA-II uses the crowding distance, introduced in Equation (14), to reduce the number of participants.
The evolution of the execution time according to the different parameters of NSGA-II is represented in Figure 7. At the same time, Figure 7a depicts the variation of execution time with the number of iterations. Additionally, Figure 7b represents the execution time by varying the probability of mutation. Finally, Figure 7c illustrates the final Pareto front where the mutation rate =
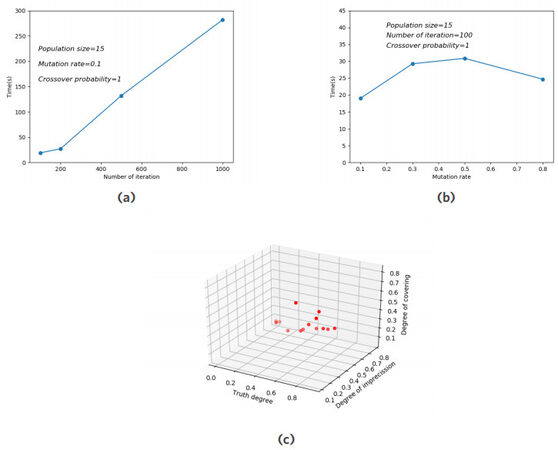
Figure 7. The evolution of multi-objective genetic algorithm. (a) Execution time according to the number of iterations; (b) Execution time according to the mutation rate; (c) Final Pareto front.
Furthermore, the various criteria of optimization using NSGA-II with 100 iterations and with a probability of mutation equals to 0.1, the set of the best solutions are given in Table 2. The set of results depicted in Table 2.A represents the first front of Pareto (i.e., the summaries obtained from the initial population that are not dominated in the sense of Pareto optimality). Similarly, the summaries of the elements of the second front of Pareto (i.e., the summaries obtained from the initial population without the summaries of the first front of Pareto) are shown in Table 2.B.
Linguistic summaries using NSGA-II
| Table 2.A First pareto front | ||||
| Summary | Truth | Imprecision | Covering | Appropriateness |
| Around half trends with moderate variability are short | 0.944 | 0.329 | 0.473 | 0.024 |
| Around half average trends have high variability | 0.939 | 0.115 | 0.701 | 0.080 |
| Around half long trends have high variability | 0.873 | 0.230 | 0.686 | 0.090 |
| Most average trends have moderate variability | 0.753 | 0.115 | 0.812 | 0.030 |
| Table 2.B Second pareto front | ||||
| Summary | Truth | Imprecision | Covering | Appropriateness |
| Around half trends with high variability are short | 0.837 | 0.329 | 0.445 | 0.003 |
| Most trends with low variability are short | 0.7 | 0.329 | 0.454 | 0.005 |
CONCLUDINGREMARKS ANDFUTUREWORK
In this work, using the paradigm of genetic algorithms, we proposed a model to improve the linguistic summaries of time series. The main target was to generate a set of best summaries of dynamic characteristics of trends associated to the time series, using a simple genetic algorithm, where the evolution function represents the truth degree. Then, we used the multi-objective genetic algorithm NSGA-II, where the proposed fitness function includes various degrees of validity to ensure high quality generated summaries.
As a future work, we plan to examine other variants of summaries propriety measures (e.g., similar to [37]). Another future direction is to implement a meta heuristic model, such as the ant colony. This model relies on the construction of the solution instead of using the genetic algorithm which uses the principle of improving the solution.
DECLARATIONS
Authors' contributions
Made substantial contributions to conception and design of the study, made implementation, performed data analysis, and interpretation: Boulanouar K, Hadjali A, Lagha M
Availability of data and materials
Not applicable.
Financial support and sponsorship
None.
Conflicts of interest
All authors declared that there are no conflicts of interest.
Ethical approval and consent to participate
Not applicable.
Consent for publication
Not applicable.
Copyright
© The Author(s) 2022.
REFERENCES
1. Hesabi Z, Tari Z, Goscinski A, Fahad A, Khalil I, et al. Data summarization techniques for big data—a survey. In: Handbook on Data Centers. Springer; 2015. pp. 1109-52. https://doi.org/10.1007/978-1-4939-2092-1_38.
3. Hudec M. Fuzziness in information systems. Springer International Publishing 2016; doi: 10.1007/978-3-319-42518-4.
4. Kacprzyk J, Zadrożny S. Linguistic database summaries and their protoforms: towards natural language based knowledge discovery tools. Information Sciences 2005;173:281-304.
5. Hudec M, Bednarova E, Holzinger A. Augmenting statistical data dissemination by short quantified sentences of natural language. Journal of Official Statistics 2018;34:981-010.
6. https://doi.org/10.1007/0-306-46991-X_6. ]]>.
7. Castillo-Ortega R, Marín N, Sánchez D. Fuzzy quantification-based linguistic summaries in data cubes with hierarchical fuzzy partition of time dimension. In: International Conference on Intelligent Data Engineering and Automated Learning. Springer; 2009. pp. 578-85. https://doi.org/10.1007/978-3-642-04394-9_70.
8. Cariñena P, Bugarn A, Mucientes M, Barro S. A language for expressing fuzzy temporal rules. Mathware and Soft Computing 2000;7:213-27.
9. Kacprzyk J, Wilbik A, Zadrozny S. Linguistic summarization of trends: a fuzzy logic based approach. In: Proceedings of the 11th International Conference Information Processing and Management of Uncertainty in Knowledge-based Systems; 2006. pp. 2166-72. http://www.math.s.chiba-u.ac.jp/yasuda/open2all/Paris06/IPMU2006/HTML/FINALPAPERS/P464.PDF.
10. Kacprzyk J, Wilbik A, Zadrożny S. Linguistic summarization of time series using a fuzzy quantifier driven aggregation. Fuzzy Sets and Systems 2008;159:1485-99.
11. Kacprzyk J, Wilbik A, Zadrożny Sa. An approach to the linguistic summarization of time series using a fuzzy quantifier driven aggregation. International Journal of Intelligent Systems 2010;25:411-39.
12. Keogh E, Chu S, Hart D, Pazani M. An online algorithm for segmenting time series. In: Proceedings 2001 IEEE international conference on data mining. IEEE; 2001. pp. 289-96.
13. https://doi.org/10.1142/9789812565402_0001. ]]>.
14. Novák V, Perfilieva I. Time series mining by fuzzy natural logic and F-transform. In: 2015 48th Hawaii International Conference on System Sciences. IEEE; 2015. pp. 1493-502.
15. Zadeh LA. A computational approach to fuzzy quantifiers in natural languages. In: Computational linguistics. Elsevier; 1983. pp. 149-84. https://doi.org/10.1016/B978-0-08-030253-9.50016-0.
16. Deb K, Pratap A, Agarwal S, Meyarivan T. A fast and elitist multiobjective genetic algorithm: NSGA-Ⅱ. IEEE transactions on evolutionary computation 2002;6:182-97.
17. NeoCampus; . https://www.irit.fr/neocampus/fr/.
19. Kacprzyk J, Yager RR, Zadrożny S. A fuzzy logic based approach to linguistic summaries of databases. International Journal of Applied Mathematics and Computer Science 2000;10:813-34.
20. Kacprzyk J, Yager RR. Linguistic summaries of data using fuzzy logic. International Journal of General System 2001;30:133-54.
21. Kacprzyk J, Zadrozny S. Protoforms of linguistic database summaries as a human consistent tool for using natural language in data mining. In: Software and Intelligent Sciences: New Transdisciplinary Findings. IGI Global; 2012. pp. 157-68.
22. Boulanouar K, Hadjali A, Lagha M. Data Summarization for Sensor Data Management: Towards Computational-Intelligence-Based Approaches. International Journal of Computing and Digital Systems 2020;10:1-9.
23. Davis L. Handbook of genetic algorithms New York, USA: Van Nostrand Reinhold; 1991.
24. Konak A, Coit DW, Smith AE. Multi-objective optimization using genetic algorithms: A tutorial. Reliability Engineering & System Safety 2006;91:992-007.
26. Yager RR. On ordered weighted averaging aggregation operators in multicriteria decision making. IEEE Transactions on systems, Man, and Cybernetics 1988;18:183-90.
27. Genç S, Akay D, Boran FE, Yager RR. Linguistic summarization of fuzzy social and economic networks: an application on the international trade network. Soft Computing 2020;24:1511-27.
28. Cariñena P, Bugarín A, Mucientes M, Barro S. A language for expressing expert knowledge using fuzzy temporal rules 1999.
29. Sklansky J, Gonzalez V. Fast polygonal approximation of digitized curves. Pattern recognition 1980;12:327-31.
30. Boulanouar K, Hadjali A, Lagha M. A Hybrid Approach for Linguistic Summarization of Time Series. In: 2020 International Conference on Data Analytics for Business and Industry: Way Towards a Sustainable Economy (ICDABI). IEEE; 2020. pp. 1-5.
31. Kacprzyk J, Wilbik A, Zadrozny S. Using a genetic algorithm to derive a linguistic summary of trends in numerical time series. In: 2006 International Symposium on Evolving Fuzzy Systems. IEEE; 2006. pp. 137-42.
32. http://dx.doi.org/10.2991/eusflat.2011.145. ]]>.
33. Castillo-Ortega R, Marín N, Sánchez D, Tettamanzi AG. A multi-objective memetic algorithm for the linguistic summarization of time series. In: Proceedings of the 13th annual conference companion on genetic and evolutionary computation; 2011. pp. 171-72. https://doi.org/10.1145/2001858.2001954.
34. Donis-Diaz CA, Bello R, Kacprzyk J, et al. Linguistic data summarization using an enhanced genetic algorithm. Czasopismo Techniczne 2013;2013:3-12.
35. Altintop T, Yager RR, Akay D, Boran FE, Ünal M. Fuzzy linguistic summarization with genetic algorithm: An application with operational and financial healthcare data. International Journal of Uncertainty, Fuzziness and Knowledge-Based Systems 2017;25:599-620.
36. Donis-Diaz C, Muro A, Bello-Pérez R, Morales EV. A hybrid model of genetic algorithm with local search to discover linguistic data summaries from creep data. Expert systems with applications 2014;41:2035-42.
Cite This Article
Export citation file: BibTeX | RIS
OAE Style
Boulanouar' K, Hadjali A, Lagha M. Trends summarization of times series: a multi-objective genetic algorithm-based model. J Smart Environ Green Comput 2022;2:19-33. http://dx.doi.org/10.20517/jsegc.2021.25
AMA Style
Boulanouar' K, Hadjali A, Lagha M. Trends summarization of times series: a multi-objective genetic algorithm-based model. Journal of Smart Environments and Green Computing. 2022; 2(1): 19-33. http://dx.doi.org/10.20517/jsegc.2021.25
Chicago/Turabian Style
Boulanouar', Khedidja, Allel Hadjali, Mohand Lagha. 2022. "Trends summarization of times series: a multi-objective genetic algorithm-based model" Journal of Smart Environments and Green Computing. 2, no.1: 19-33. http://dx.doi.org/10.20517/jsegc.2021.25
ACS Style
Boulanouar', K.; Hadjali A.; Lagha M. Trends summarization of times series: a multi-objective genetic algorithm-based model. . J. Smart. Environ. Green. Comput. 2022, 2, 19-33. http://dx.doi.org/10.20517/jsegc.2021.25
About This Article
Copyright

Data & Comments
Data


 Cite This Article 11 clicks

 Like This Article 34
likes
Like This Article 34
likes


Comments
Comments must be written in English. Spam, offensive content, impersonation, and private information will not be permitted. If any comment is reported and identified as inappropriate content by OAE staff, the comment will be removed without notice. If you have any queries or need any help, please contact us at support@oaepublish.com.