
Different approaches of bibliometric analysis for data analytics applications in non-profit organisations

 , ...
, ... Abstract
Aim: Profitable companies that used data analytics have a double gain in cost reduction, demand prediction, and decision-making. However, using data analysis in non-profit organisations (NPOs) can help understand and identify more patterns of donors, volunteers, and anticipated future cash, gifts, and grants. This article presents a bibliometric study of 2673 to discover the use of data analytics in different NPOs and understand its contribution.
Methods: We characterise the associations between data analysis techniques and NPOs using, Bibliometrics R tool, a co-term analysis and scientific evolutionary pathways analysis, as well as identify the research topic changes in this field throughout time.
Results: The findings revealed three key conclusions may be drawn from the findings: (1) In the sphere of NPOs, robust and conventional statistical methods-based data analysis procedures are dominantly common at all times; (2) Healthcare and public affairs are two crucial sectors that involve data analytics to support decision-making and problem-solving; (3) Artificial Intelligence (AI) based data analytics is a recently emerging trending, especially in the healthcare-related sector; however, it is still at an immature stage, and more efforts are needed to nourish its development.
Conclusion: The research findings can leverage future research and add value to the existing literature on the subject of data analytics.
Keywords
INTRODUCTION
Data technology is evolving rapidly to address global needs. The professionals and practitioners from for-profit organisations are being urged to consider data analytics applications to maximise their potential and increase productivity. However, there are recent calls to apply such analytics to NPOs’ activities such as analysing donors behaviours[1,2]. NPOs differ from for-profit organisations as they are private, independent and self-generated funds[3]. Museums, colleges, libraries, research centers, health agencies, human welfare, human rights organisations, religious organisations, and charitable foundations are examples of NPOs. NPOs are expected to gather and analyse information from stakeholders to implement effective strategies for achieving their missions’ objectives[4]. The role of data analytics in NPOs’ activities is significant; it can assist such organisations in monitoring, evaluating, and determining barriers to their success, and can provide meaningful visualisations to support decision-makers. Moreover, applying big data to NPOs’ activities is significant; big data also assist NPOs in the logical deployment of resources[2]. Kassen et al.[5] doubted that governmental agencies and social community organisations can improve innovation by applying big data. However, Mayer et al.[2] confirmed that big data enables NPOs to efficiently collect information about fundraising participants and identify potential donors. Recently, big data has been used by many enterprises and organisations. Big data refers to massive, unstructured and complex datasets that are extracted from different sources and then stored, processed and analysed. The key characteristics of big data are volume (i.e., the size of the data), variety (i.e., the various sources of the data), and veracity (i.e., the quality of the data)[6]. Researchers should continue to investigate the potential of big data analytics in NPOs, as it may support a better understanding of decision-making[7].
Using data verifiable to make decisions may be considered as a valuable strategy in the organisation[7]. Nevertheless, there are many concerns that NPOs do not benefit from data analytics. Thus, NPOs collect data but less often use it to analyse certain activities such as analysing donors behaviours and predicting future donations[7]. Certain challenges faced by NPOs have led to an underutilisation of big data in such organisations. These include a lack of capable staff to manage, manipulate, analyse, and visualise data, as well as limited financial resources. For example, only 2% of NPO budgets are spent on information technology infrastructure[8]. However, cloud solutions can be affordable for such organisations, and the processing of large-scale data could be enhanced by offering training sessions for staff[8].
Considering the opportunities and challenges of applying big data in NPOs, it is crucial to avoid any gaps in the research and share the required knowledge to benefit the maximum number of scholars. However, there is still needed to present and report empirical studies, case studies, and experiments using data analytics in NPOs. To better investigate how data analytics is being applied in different NPOs, we conducted a bibliometric analysis to evaluate the contribution and the evolution of data analytics in NPOs scientific research. Bibliometrics, or scientometrics, are quantitative methods used to measure and map the existing research in a scientific discipline[9]. The bibliometric analysis provides a comprehensive analysis of research trends and assesses science as a productive knowledge system[9]. A bibliometric analysis exposes the internal structure and development pattern of a specific research path or journal. It has been widely applied to various fields such as computers and information ethics[10].
The authors incorporate quantitative analysis (using bibliometrix R-tool), co-term analysis and scientific evolutionary pathways (SEP) to identify the associations between prevalent data analysing techniques and various types of NPOs and identified the research topic changes over time. By applying those analyses: this paper profiles the research landscape of this field and generates the following insights:
1. Robust and classic statistical methods-based data analysing techniques are dominantly prevalent in the NPO field all the time.
2. Healthcare and public affairs are two crucial sectors that involve data analytics to support decision-making and problem-solving.
3. AI-based data analytics is a recently emerging trending, especially in the healthcare-related sector. However, it is still immature, and more efforts are needed to nourish its development.
The rest of this paper is framed as follows: Section “MATERIALS AND METHODS” presents the materials and used methods, including collecting data, searching databases, and the used methodology. Section “RESULTS” presents the main bibliometric analysis and the results. Section “DISCUSSION AND FUTURE WORK” presents the discussion along with the challenges, limitations, and future work and finally the paper is concluded in section “CONCLUSIONS”.
MATERIALS AND METHODS
Related work: bibliometric analysis
Bibliometrics, often known as “scientometrics”, is a quantitative tool for measuring and mapping existing research in a scientific area[9]. A bibliometric analysis is a study that aims to uncover the fundamental structure of a field’s research[11]. It analyses research trends in depth, evaluates science as a productive knowledge system[9], and is trustworthy and objective[12]. There are different applications of bibliometric analysis, however; Biblometrix, an associated tool with an R-package[13], was created in response to the perception that scientometric analysis is difficult and unclear. The Bibliometrix software allows researchers to import data from Scopus, Web of Science, PubMed, and Cochrane databases, as well as perform bibliometric analysis[13]. It also has data metrics for author and country collaboration analysis, word analysis, and author productivity analysis and authors collaborations.
Limited research has been conducted to explain the evolution of various scientific subjects around data analytics and identify emerging trends, and assess the performance and influence of countries, regions, scholars, and research organisations in specific fields of science[9,11,12]. Trivedi et al.[9] conducted a study on data analytics using Bibliometrix R tool. The results are to provide policymakers, researchers, and people in agriculture with a comprehensive understanding of Agriculture Big Data research for future research. Esfahani et al.[12] also conducted a bibliometric analysis to look into the current state and progress of scientific studies on the impact of social networks on big data and the use of big data to model the behaviours of social network users. In another bibliometric study[11], total publications, total citations, and citation per paper are among the performance measures calculated.
Although the previous studies[9,11,12] have conducted a number of metrics and indicators that measure the trends of research in their specific area, and are not related to NPOs, their work provided a broad analysis over a long duration, but it is difficult to identify development trends, evolutionary paths of keywords and emerging topics over different time periods in data analysis applications in NPOs. As a result, it is required that scholars can better understand the evolution of data applications in NPOs and obtain insights for scholars in NPOs solving their problems. There is a dearth of researchers who have attempted to investigate the studies of data analytics applications in NPOs using bibliometric indicators.
Research process
The researchers introduced a framework to effectively organise the work. Figure 1 illustrates the framework applied which contains five phases and reporting the results. Most importantly, each phase has an output that is an input of the following phase.
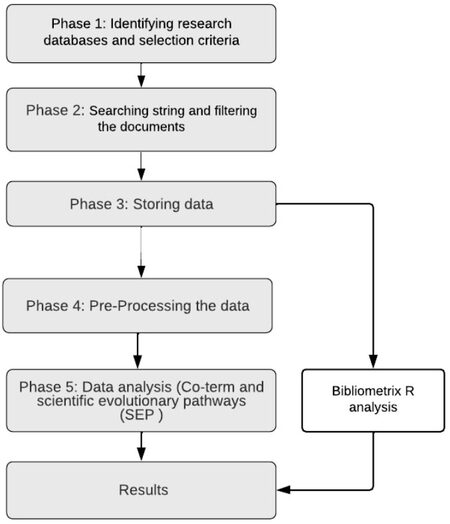
Figure 1. Research process framework.
Phase 1: Identifying research databases and selection criteria
We chose three databases Web of Science (https://www.webofscience.com/wos/woscc/basic-search), Scopus (https://www.scopus.com/home.uri) and ProQuest (https://www.proquest.com/) to conduct the indexed data search for publications discussing data analytics in NPOs. The databases are the wider collection of scholarly journals, books and proceedings in the sciences and social sciences; their wide coverage and complete bibliographic information make them our primary choice for the data source. We also selected Scopus and ProQuest to complementarily obtain additional publications in the recent two decades[14]. We then applied multiple selection criteria to include precise publications that match the research scope, as shown in Table 1. The three items that constitute the selection criteria are: searching only in titles, abstracts, and keywords of each document, the period of publications is from January 1973 to January 2021, and only English written documents.
Selection criteria
| Item | Restriction | Description |
| Search field | Titles, abstract, and keywords | The search for the data is only in three fields of each database: titles, abstracts, and keywords |
| Period | January 1973-January 2021 | For comprehensive coverage of literature |
| Language | English | Only English documents are to be included for consistent processing and analysis |
Phase 2: Searching string and filtering the documents
We included a search string using major keywords and alternative synonyms for accurate results, using the Boolean operations (AND, OR). For example, on Scopus, TITLE-ABS-KEY [(“Data analy*” OR “Data-driven” OR “Analy*”) AND (“Nonprofi*” OR “Non-Profi*” OR “no*for*profit*”)]. A detailed search string is shown in Appendix A to provide a full coverage of different types of data analysis in NPOs. The publications are extracted (included bibliographic data, keywords, and citation data) after applying the selection criteria from each database.
Before moving on to the next phase, we removed 603 duplications in our search results due to the database collection overlap. Then a manual assessment was applied to exclude 541 publications that are not relevant to our research scope based on their titles and abstracts. Table 2 presents the number change of our search publications.
The number change in our search publications
| Database | Raw results | After duplication removal | After Manual assessment filtering |
| Scopus | 2089 | 3214 | 2673 |
| Web of Science | 923 | ||
| ProQuest | 805 |
Phase 3: Storing the data and Bibliometrix analysis
After we obtained 2673 documents after manual assessment filtering, the data was stored in the format of a Comma Separated Values (CSV). Then, the data is imported into Bibliometrix R Package to perform quantitative analysis. While there are various tools of bibliometrics such as VOSviewer and Bibexcel[15], Bibliometrix R tool is chosen because it supports the importation of data from the Scopus, Web of Science, PubMed and Cochrane databases, and enables bibliometric analyses to be conducted[13]. It also provides data metrics for coupling, collaboration analysis of authors and countries, word analysis, and author productivity analysis[13]. In this research context, the bibliometrix package analysis aims to map the structure of research on big data in NPOs and visualise the analysis. Before applying the analysis, the data file was checked to ensure that the necessary attributes are available, and to clean the missing values. The process of importing the data into Bibliometrix R package is simple, as we chose the best analysis and explained them in detail in Section “RESULTS” of this paper.
Phase 4: Pre-processing the data
In this phase, we conducted a data pre-processing procedure to obtain the inputs for co-occurrence and SEP analyses. Specifically, we exploited using natural language function integrated into VantagePoint software to extract terms using a process of inclusion and exclusion[16] was applied to the extracted terms to accomplish term cleaning and consolidation. The stepwise pre-processing results are given in Table 3.
The stepwise pre-processing results
| Step | Description | Terms |
| 1 | NLP processed terms selection | 73,357 |
| 2 | Consolidation of search terms | 66,804 |
| 3 | Duplication removal | 55,604 |
| 4 | Duplicate entries removal | 46,268 |
| 5 | Consolidation of similar keywords | 44,787 |
| 6 | Eliminated all terms occurring less than 2 times | 2349 |
| 7 | Manually select terms of data analysing methods and non-profit organisations with top frequencies* | 10/17** |
Phase 5: Data analysis (Co-term analysis and SEP)
Co-term analysis
Co-term analysis is a classical topic analysis method in bibliometrics[10,17]. It adopts the assumption that two terms that appear in the same context may share similar semantic meanings. The collection of such term co-occurrences can constitute a co-term network represented as G = (V, E), where V denotes the set of terms and E denotes the co-occurrences between them. This paper adopts the terms selected in Step 7 of Table 3 and profiles the associations between different types of NPOs and the prevalent data analysing techniques.
SEP
SEP is a research topic tracking method developed by Zhang et al.[18]. It is used to identify the changes in research attention in time-labelled streaming documents. This basic assumption of this method is that scientific novelty derives from the accumulative changes and recombination of existing knowledge[19,20]. We employed this method to identify the topic changes at a macro level. The definitions and stepwise explanations of the SEP are stated below.
Algorithm design: Initially, the SEP represents every document with scientific terms (in our case, the terms are obtained from Step 6 in Table 3) and aligns all documents with a term-document matrix; in such case, every document can be represented as a term vector with the entire vocabulary as the feature space. By separating the documents into consecutive time slices, SEP measures the drifts of documents and assigns documents to topics generated in different years to indicate the topics and their changes.
Concept definition: A topic is defined as a collection of documents that share semantically similar research content, denoted as T. The centroid of a topic is represented by the mean vector of all corresponding document vectors in the topic, denoted as c. The radius of a topic is defined as the largest Euclidean distance of all the documents in the topic to the centroid, defined as r, using standard 5 steps processes suggested in the study of Zhang et al.[18]. The final outcome of SEP is a visualising map with nodes representing the topics and directed edges linking those topics representing the descendent-predecessor relationships between connected topics.
RESULTS
Bibliometrix R-tool analysis
The most effective tool for visualisation R studio has been used for scientific computation over other languages[13]. We obtained a variety of analyses using Bibliometrix R tool that are explained as followed:
Subject areas of the documents
Figure 2 shows ten different subject areas being identified where data analysis was applied in NPOs. Among these areas, Computer Science had the most published and written documents related to applications of data in NPOs, with around 24% of the documents. The second most published area was social science, with 17% of the documents. Many papers also categorised NPO-related papers as relating to social sciences. Engineering, Business, Management, and Accounting are the next most common subject area, with 11% of documents, whereas biochemistry, genetics, molecular, mathematics and neuroscience had the lowest percentages of published papers related to big data in NPOs. Most importantly, there are some areas where data analysis could solve such problems and provide meaningful results.
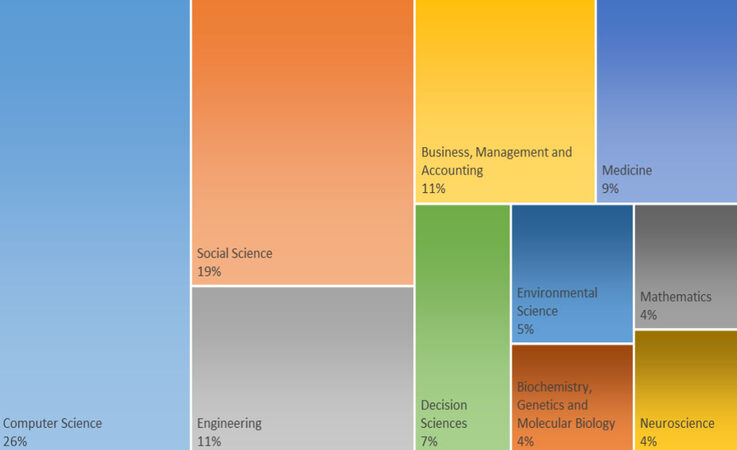
Figure 2. Subject areas of documents.
Word dynamics
Creating a word dynamic graph assists researchers to understand keyword dynamics over time. Such a graph shows increases or decreases in keyword frequency over time, enabling the selection of the most suitable title when conducting a literature review or the identification of a further research topic. Figure 3 shows the shifts in the most common author keywords from 2012 to 2020. “Big data” had the highest occurrence during the entire period, whereas “nonprofit” peaked near the beginning of the period. Other keywords with similar dynamics included “Social media” and “Open Data”.
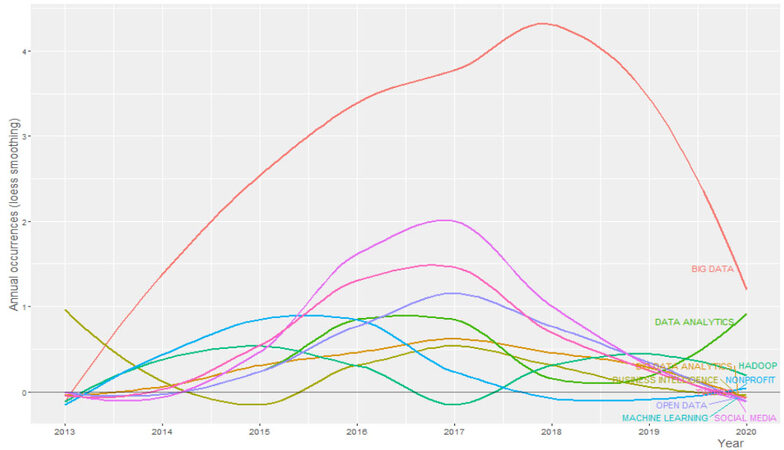
Figure 3. Word dynamics from 2012 to 2020.
Co-occurrence network
A keyword co-occurrence network (KCN) illustrates the knowledge, contents, and structures of a technical and scientific topic by identifying the relationships between keywords in the literature[13]. Figure 4 illustrates the co-occurrence network for Keywords Plus, although author keywords may also be used. In the figure, each cluster has a different colour and keywords are grouped according to their co-occurrence in the same papers. Keywords such as “human”, “big data”, “humans”, “non profit organization”, “procedures” and “united states” were commonly cited and mentioned in the same papers.
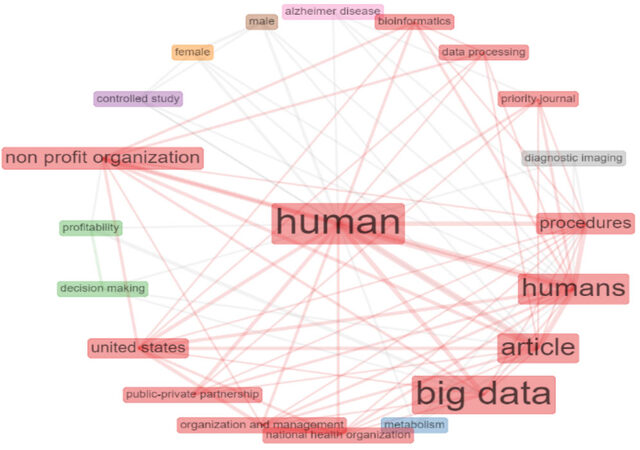
Figure 4. Co-occurrence network keywords.
Conceptual structure map
Another type of co-keyword analysis is the conceptual structure map (also known as a factorial map[13]). The map shown in Figure 5 was created using a Multiple Corresponding Analysis (MCA). Two clusters (blue and red) are shown on the map, representing the most common author keywords. The figure shows that keywords related to the application of big data in NPOs, including “data analytics”, “big data”, “data processing”, and “data mining”, were frequently used in similar topics. In contrast, keywords related to NPOs and data, such as “humans”, “nonprofit organisations” and “data processing”, are grouped in the red cluster. This indicates that, within the red cluster, there have been unattended applications of big data in NPOs.
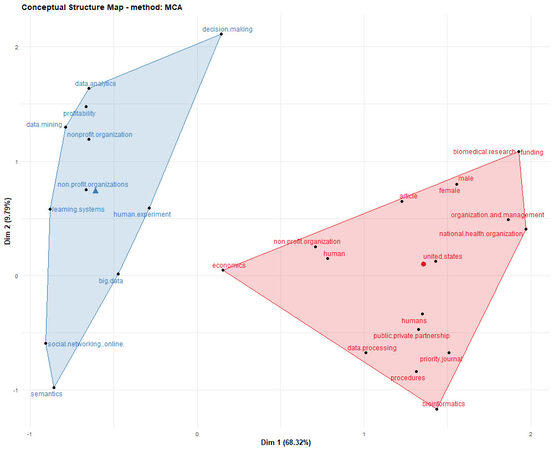
Figure 5. Factorial map of most frequent keywords.
Considering that bibliometrix provides various techniques to analyse the publications, some limitations are found during the analysis process. There are other potentials for other bibliometric analysis techniques that can overcome these limitations such as co-terms and SEP analysis.
Co-term analysis
By applying co-term analysis to the ten terms describing non-profit organisations and seventeen terms indicating data analysis techniques, we produced a co-term map in Figure 6 with the aid of Circos Table Viewer (More details could be found at http://mkweb.bcgsc.ca/tableviewer/visualize/). Figure 6 yields a bird’s eye view of (1) the frequently mentioned data analysis methods in the field and the key types of NPOs, represented by the arc length of terms, and (2) how strong data analysis methods are related to different types of NPOs, represented by the width of ribbons connecting two terms.
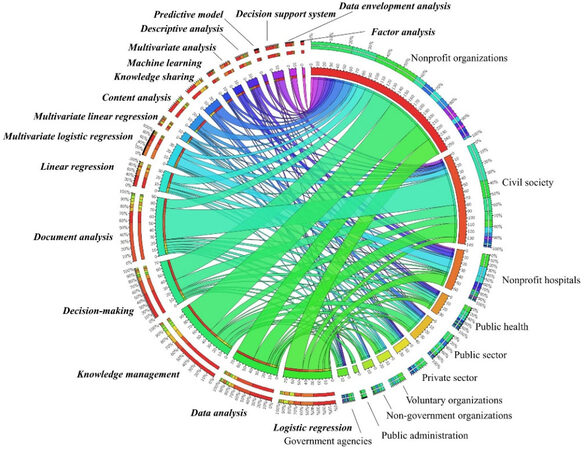
Figure 6. Co-term network visualisation.
Observing the arc length of those terms, we could identify that organisation management-related and statistics-based data analysing methods, such as document analysis, knowledge management, data analysis, decision making, and logistic regression, are frequently seen in relevant NPOs publications. Intriguingly, data analysis methods in the computer science domain also appear on this map, including decision support system, predictive model and machine learning, even though they seem less prevalent than the top ones. The frequency ranking of those methods indicates that current NPOs still prefer to apply those robust, classical and organisation management-related methods in real-world implementations. Nevertheless, the utilisation of novel computer science-based methods is still an emerging trend. Next, we focus on the linking strength of different NPOs data analysis method pairs. From the NPOs perspective, in healthcare-related NPOs such as nonprofit hospitals and public health, the dominating techniques are mostly derived from statistical analysis like logistic regression and multivariate logistic regression, representing the typical data analysis methods in the medical domain. However, in other public affair-related NPOs such as public sector or public administration, knowledge management seems to take a more crucial role in the associated studies. From the technique perspective, we could see document analysis is notably involved with civil society; in such cases, document analysis is widely used to identify the impacts and roles of civil society using multiple case studies[21-23]. Some AI-related techniques like a predictive model and machine learning tend to have stronger associations with the healthcare domain including nonprofit hospitals and public health, indicating the emergence of those techniques in the healthcare sector.
Evolutionary relationship identification
We generated a topic evolutionary with 87 nodes and 86 edges by applying SEP to the extracted terms. Every node represents a research term and each directed edge represents the predecessor-descendant relationship between the connected nodes, time labels in the brackets indicate when the topic was proposed. With the aid of Gephi[24], a community detection algorithm is used in the SEP network and partitioned it into five topic communities with different colours, as shown in Figure 7. The topic communities could respectively be concluded as #1 data processing (pink), #2 public health and health management (green), #3 hospital management (orange) and #4 public affair and knowledge management (blue).
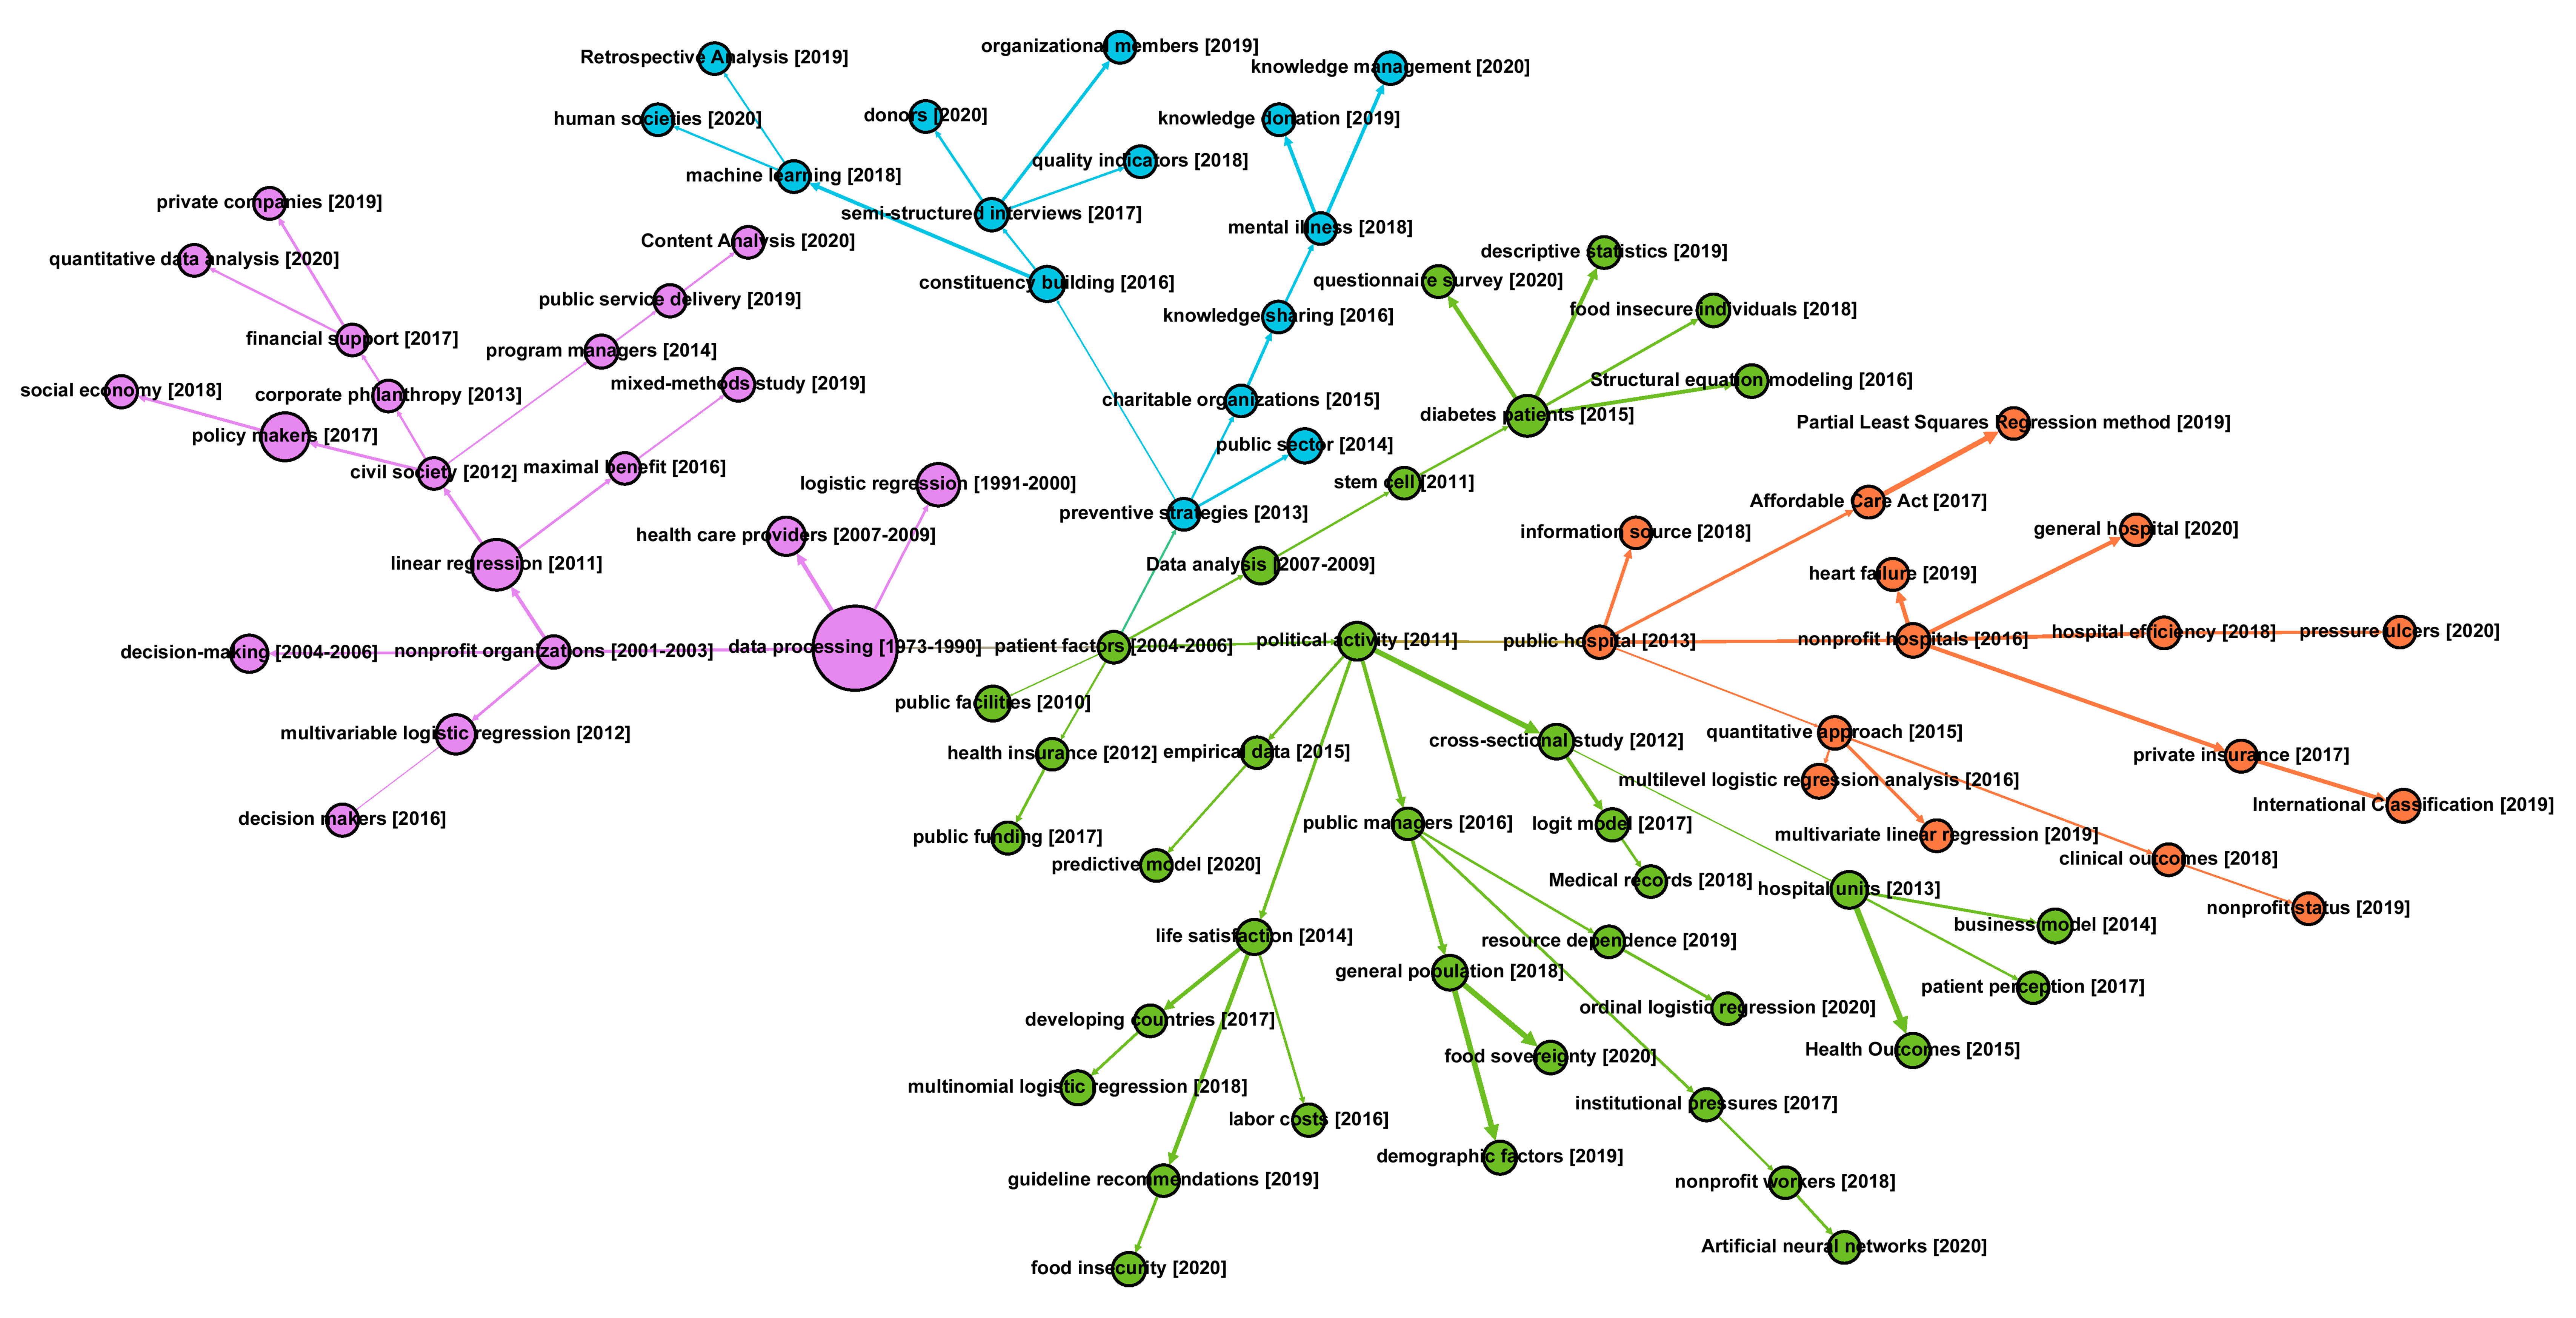
Figure 7. Scientific Evolutionary Pathways (SEP) diagram.
The four communities represent the evolving patterns and divergence of research attention in this field over time. Tracing back to 1973, the initial topic data processing [1973-1990] indicates the emergence of data utilisation needs and data analysis means in NPOs at the early stage. This topic derives a pink topic community #1 data processing, in which we could observe topics focusing on classical and traditional statistical methods (linear regression [2011], logistic regression [1991-2000]) and classical organisational roles (program managers [2014], policy makers [2017]). Even the topics at the end of those branches, which represent the recent changes, are still related to basically organisational or data analysis concepts such as decision making [2004-2006], decision makers [2016], and quantitative data analysis [2020]. Hence, we summarise that this community profiles a fundamental and traditional pathway of how the data analysis methods are applied in NPOs.
Derived from community #1, community #2 public health and health management has a clear emphasis on the healthcare sector. Some of those topics reveal the healthcare data sources like empirical data [2015] and medical records [2018], while some others reflect realistic problems that using data analytics to solve in the medical domain such as stem cell [2011], diabetes patients [2015], life satisfaction [2014], labour costs [2016], guideline recommendations [2019], etc. The rest topics mostly refer to specific data analysis methods. Interestingly, except for the data analysis methods identified in community #1, a few AI-related topics like predictive model [2020] and artificial neural networks [2020] emerge from which we could have a glimpse of artificial intelligence implementation for data analysis in the healthcare domain. However, the limited amount of such topics also indicates this trend is still in its infancy.
Community #3 typically inherits the healthcare attribute of community #2 and focuses on a more specific domain of hospital management. Topics in this community cover hospital attributes [public hospital [2013], nonprofit hospitals [2016], nonprofit status [2019] and general hospital [2020]), evaluating metrics (hospital efficiency [2018], clinical outcomes [2018] and pressure ulcers [2020] (Pressure ulcer incidence rate is an important evaluation metric for clinical nursing quality)], policy-related issues (private insurance [2017] and Affordable Care Act [2017]), and data analysis methods used on hospital management issues. From the technical perspective, data analysing techniques applied in this topic community are still highly coupling with the fundamental ones in community #1.
Lastly, community #2 additionally derives another community #4 public affair and knowledge management. Different from community #2, community #4 expands the scope of topics to a wider public affair sector. Politics and charity-related topics (charitable organisations [2015], constituency building [2016] and donors [2020]) are frequently seen in this community, accoupling with a branch emphasising knowledge management concerns in organisations (knowledge sharing [2016], knowledge donation [2019] and knowledge management [2020]). The appearance of another AI-related topic, machine learning [2018], indicates AI’s application has also started to emerge in those public sectors.
Evolutionary pathways span time born topics that could be seen in each cluster, meaning that certain publications’ inspiration is being disrupted by new awareness at various levels. The feature to track the evolutionary paths of scientific subjects is the SEP’s key advantage, although the graph of the SEP’s visual routines can only show changes in topics. As nonprofit organizations were set to be used from 2001 to 2003 in data processing, it appears twice recently as alternative terms charitable organisations and nonprofit hospitals in 2015 and 2016, respectively. This indicates the excellent representative to present the evolutionary pathway in a dynamic way of disturbing data and feature space.
DISCUSSION AND FUTURE WORK
Although the research was conducted on three databases, the obtained results are subject to be scalable by involving more databases and visualization tools. For example, there are other effective visualisations tools such as Gephi, Pajek, VOSviewer, and Bibexcel[25]. Therefore, useful results may be generated to provide answers to specific answers to research questions. Moreover, other bibliometric analysis techniques could be applied such as citation analysis. When two publications appear in the reference list of another article, they are linked in a co-citation network. Scholars can benefit from co-citation analysis by learning about theme clusters in addition to locating the most important publications[25]. Therefore, co-citation analysis is appropriate for business academics looking to identify key works and theoretical basis[25]. A comprehensive review can be carried out in near future by involving more databases to get more data insights on the search topics, through the inclusion of additional categories of searched documents including trade periodic, white papers, case studies and newspaper articles. The expansion of the types of documents and sources can add more value in terms of the scope of study and scalability of the subject.
The research implications can broadly be applied to various industries and social enterprises at various levels. The cross-industrial applicability of the topic can be done in various forms, viz, humanitarian operations, crowdfunding, data generation, and analysis through social media analysis. In addition, the research results have vast sectorial coverage in public, private, government, semi-government, and private enterprises. For example, some researchers in the public sector may be interested in linking research topics in the NPOs sector with the public sector through collaborative studies in studying such known drawbacks. Most importantly, in many nations, several NPOs may collect big datasets from donors and volunteers; however, applying such data analytics has several limitations. Therefore, this study would benefit academics by introducing such research frameworks and practical and theoretical foundations that enhance the research productivity in NPOs and tackle known limitations. The results of this study, including the research framework, may be in the interest of different sectors to apply a development that leads to the creation of valuable analysis.
Various applications of data collection and analysis techniques are obtained as the result of the study, which can be further instrumented for industrial data collection, more specific to industrial domains including both social sector, service industry and manufacturing setups. Thus, the research results give a comprehensive roadmap toward practical implications of data analytics, its usage and its practical application. Broadly, the study’s results may contribute to comparing the trends of applying data analytics in different areas of NPOs such as charities, healthcare, pharmaceutical, health centers, educational institutions, and social agencies. The comparison may urge scholars to seek the possible directions of obtaining the advantages of applying data analytics and enhancing decision-making in NPOs.
Challenges and Limitations
Currently, data analysis presents significant challenges for NPOs due to a lack of technical skills[7] and financial resources[26]. Meanwhile, decision-making solutions are required to help NPOs in making better decisions about donors and understanding their behaviours such as donors’ returning or becoming frequent donors[27]. According to the co-occurrence network figure, research on decision-making methods and solutions is scarce. There are some new decision-making solutions that can be applied to NPOs through conducting case studies for more validation. Another challenge is the rapid growth of information, which become critical for applying such efficient solutions for managing data resources. For instance, big data also assist governmental agencies and civil society by participating in improving innovation and cost-effectiveness[5]. However, big data has a complex data structure that necessitates the use of commotional techniques to process.
There are also some limitations in our current study. From the methodological perspective, co-term and SEP analyses are based on the correlation between semantic similarities of terms. Yet, they neglect the causality or sentiment associations (positive or negative) between terms, limiting us to interpret the deeper reasons for the term relationships and evolutionary patterns. Another limitation is that relevant research papers allocated beyond the scope of this study were excluded, although they have a high rate of keyword occurrence. For example, several studies related to medical research containing medical and health research keywords seem irrelevant to NPOs. The selection of keywords during the search stage was changed several times to ensure all the found documents have lied in the scope of applying data analytics in NPOs. In future studies, we aim to involve sentiment analysis and causality inference techniques to improve our methodology in order to provide a deeper data-driven interpretation of such results. Also, comprehensive databases will be added to ensure the full coverage of the literature.
Future directions
Considering the above challenges, there could be some possible directions to facilitate the usage of data analytics applications in NPOs, and the following points may attract scholars:
(i) Unique decision-making processes combine the qualities of other subjects, can help in creating different angles of solutions from other subjects. Interdisciplinary research can expand the diversity and applicability of proposed solutions as more and more actual challenges involve many fields. For example, using machine learning or other technologies, researchers could make full use to discover more features and hidden information that lead to decision-making enhancement.
(ii) Some innovative and remarkable ideas or procedures could be presented and used for some purposes, based on their efficacy and practicability. Machine learning and automatic algorithms, for example, are being used in different disciplines to resolve such compilated problems which may lead to improvements in the decision-making process. In the future, human-computer interactions in a variety of sectors will be possible[10].
(iii) Furthermore, there are numerous other issues and directions in applying data analytics in NPOs, and the advancement of bibliometric analysis has allowed us to comprehend emerging subjects and forecast data analytics in NPOs trends from a variety of perspectives. For one point, keywords from various periods may aid scholars in comprehending the evolution of data analytics. Furthermore, researchers can refer to the profiles of authors, institutions, and regions when they need to collaborate and communicate. Thus, bibliometric analysis is a crucial tool for researchers to comprehend study fields.
CONCLUSIONS
This paper is a one-of-a-kind compilation of bibliometric research and recent advances in the field of data analytics in NPOs. This study conducted, Bibliometrix R tool, co-term and SEP analyses on 2673 documents to reveal the NPO-data analysis technique relationships and topic evolutionary patterns from data analytics research in NPOs. The results from co-term and SEP maps complement each other and together yield the following insights: (1) classic statistics-based data analysing techniques are dominantly applied in the NPO field all the time; (2) Healthcare and public affairs are two significant sectors that involve data analytics to support decision-making and problem-solving; (3) AI-based data analytics is an emerging trending in this field, especially in the healthcare-related sector, however, it is still at an immature stage, and more efforts are needed to nourish its development. Findings in this study could benefit (1) Researchers with evidence to conduct longitudinal analyses and investigate the status quo of data analytics in NPOs, and (2) Researchers with empirical insights in recognising the potential of data analytics and implementing data analytics in some sectors such as public sectors, governmental agencies, and private-public organisations.
DECLARATIONS
Authors’ contributionsContributed solely to the article: Alsolbi I, Wu M
Conception and design of the study and performed data analysis and interpretation: Zhang Y, Joshi S, Sharma M, Tafavogh S, Sinha A
Performed data acquisition, as well as provided administrative, technical, and material support: Alsolbi I, Prasad M
Availability of data and materialsNot applicable.
Financial support and sponsorshipNone.
Conflicts of interestAll authors declared that there are no conflicts of interest.
Ethical approval and consent to participateNot applicable.
Consent for publicationNot applicable.
Copyright© The Author(s) 2022.
REFERENCES
1. Johnson MP. Data, analytics and community-based organizations: transforming data to decisions for community development. I/S: A Journal of Law and Policy for the Information Society 2015;11:49. Available from: https://heinonline.org/HOL/LandingPage?handle=hein.journals/isjlpsoc11&div=7&id=&page= [Last accessed on 27 Jul 2022].
2. Mayer LH. The promises and perils of using big data to regulate nonprofits. Washington Law Review; 2019. pp. 1281-1336. Available from: https://heinonline.org/HOL/LandingPage?handle=hein.journals/washlr94&div=33&id=&page= [Last accessed on 27 Jul 2022].
3. Anheier HK. nonprofit organizations theory, management, policy. Routledge Taylor & Francis Group. 2005. p. 450. Available from: https://www.taylorfrancis.com/books/mono/10.4324/9781315851044/nonprofit-organizations-helmut-anheier [Last accessed on 27 Jul 2022].
4. Mahmoud M, Yusif B. Market orientation, learning orientation, and the performance of nonprofit organisations (Npos). Int J Product Perform Manag 2012;61:624-52.
5. Kassen M. Adopting and managing open data: stakeholder perspectives, challenges and policy recommendations. Aslib J Inf Manag 2018;70:518-537.
6. Mohamed A, Najafabadi MK, Wah YB, Zaman EAK, Maskat R. The state of the art and taxonomy of big data analytics: view from new big data framework. Artif Intell Rev 2020;53:989-1037.
7. Maxwell NL, Rotz D, Garcia C. Data and decision making: same organization, different perceptions; different organizations, different perceptions. Am J Eval 2016;37:463-85.
8. Hackler D, Saxton GD. The strategic use of information technology by nonprofit organizations: increasing capacity and untapped potential. Public Adm Rev 2007;67:474-87.
9. Trivedi G. Visualization and scientometric mapping of global agriculture big data research. Library Philosophy and Practice; 2019. Available from: https://www.researchgate.net/profile/Guptnath-Trivedi/publication/333103959_Visualization_and_Scientometric_Mapping_of_Global_Agriculture_Big_Data_Research/links/5ed89de04585152945312a86/Visualization-and-Scientometric-Mapping-of-Global-Agriculture-Big-Data-Research.pdf [Last accessed on 27 Jul 2022].
10. Wang X, Xu Z, Su S, Zhou W. A comprehensive bibliometric analysis of uncertain group decision making from 1980 to 2019. Inf Sci 2021;547:328-53.
11. Shukla AK, Muhuri PK, Abraham A. A bibliometric analysis and cutting-edge overview on fuzzy techniques in Big Data. Eng Appl Artif Intell 2020;92:103625.
12. . Jelvehgaran Esfahani H, Tavasoli K, Jabbarzadeh A. Big data and social media: a scientometrics analysis 2019;3:145-64.
13. Aria M, Cuccurullo C. bibliometrix: an R-tool for comprehensive science mapping analysis. J Informetr 2017;11:959-75.
14. Falagas ME, Pitsouni EI, Malietzis GA, Pappas G. Comparison of PubMed, Scopus, Web of Science, and Google Scholar: strengths and weaknesses. FASEB J 2008;22:338-42.
15. Moral-muñoz JA, Herrera-viedma E, Santisteban-espejo A, Cobo MJ. Software tools for conducting bibliometric analysis in science: an up-to-date review. EPI 2020:29.
16. Zhang Y, Porter AL, Hu Z, Guo Y, Newman NC. “Term clumping” for technical intelligence: a case study on dye-sensitized solar cells. Technol Forecast Soc Change 2014;85:26-39.
17. Callon M, Courtial J, Turner WA, Bauin S. From translations to problematic networks: an introduction to co-word analysis. Soc Sci Inf 1983;22:191-235.
18. Zhang Y, Zhang G, Zhu D, Lu J. Scientific evolutionary pathways: identifying and visualizing relationships for scientific topics. J Assoc Inf Sci Technol 2017;68:1925-39.
21. Anaf J, Baum FE, Fisher M, Harris E, Friel S. Assessing the health impact of transnational corporations: a case study on McDonald's Australia. Global Health 2017;13:7.
22. Powell LJ, Wittman H. Farm to school in British Columbia: mobilizing food literacy for food sovereignty. Agric Hum Values 2018;35:193-206.
23. Secco L, Favero M, Masiero M, Pettenella DM. Failures of political decentralization in promoting network governance in the forest sector: observations from Italy. Land Use Policy 2017;62:79-100.
24. Mathieu B, Sebastien H, Mathieu J. Gephi: an open source software for exploring and manipulating networks. Third International AAAI Conference on Weblogs and Social Media; 2009: Association for the Advancement of Artificial Intelligence. Available from: https://ojs.aaai.org/index.php/ICWSM/article/view/13937 [Last accessed on 27 Jul 2022].
25. Donthu N, Kumar S, Mukherjee D, Pandey N, Lim WM. How to conduct a bibliometric analysis: an overview and guidelines. J Bus Res 2021;133:285-96.
26. Hou Y, Wang D. Hacking with Npos: collaborative analytics and broker roles in civic data hackathons. Proc ACM Hum -Comput Interact 2017;1:1-16.
27. Alsolbi I, Agarwal R, Narayan B, et al. Analyzing donors behaviors in nonprofit organizations: a design science research framework. proceedings of 3rd international conference on machine intelligence and signal processing 2021; NIT Arunachal Pradesh, India: Springer. Available from: https://www.researchgate.net/publication/357877379_Analyzing_Donors_Behaviors_in_Nonprofit_Organizations_A_Design_Science_Research_Framework [Last accessed on 27 Jul 2022].
Cite This Article
Export citation file: BibTeX | RIS
OAE Style
Alsolbi I, Wu M, Zhang Y, Joshi S, Sharma M, Tafavogh S, Sinha A, Prasad M. Different approaches of bibliometric analysis for data analytics applications in non-profit organisations. J Smart Environ Green Comput 2022;2:90-104. http://dx.doi.org/10.20517/jsegc.2022.09
AMA Style
Alsolbi I, Wu M, Zhang Y, Joshi S, Sharma M, Tafavogh S, Sinha A, Prasad M. Different approaches of bibliometric analysis for data analytics applications in non-profit organisations. Journal of Smart Environments and Green Computing. 2022; 2(3): 90-104. http://dx.doi.org/10.20517/jsegc.2022.09
Chicago/Turabian Style
Alsolbi, Idrees, Mengjia Wu, Yi Zhang, Sudhanshu Joshi, Manu Sharma, Siamak Tafavogh, Ashish Sinha, Mukesh Prasad. 2022. "Different approaches of bibliometric analysis for data analytics applications in non-profit organisations" Journal of Smart Environments and Green Computing. 2, no.3: 90-104. http://dx.doi.org/10.20517/jsegc.2022.09
ACS Style
Alsolbi, I.; Wu M.; Zhang Y.; Joshi S.; Sharma M.; Tafavogh S.; Sinha A.; Prasad M. Different approaches of bibliometric analysis for data analytics applications in non-profit organisations. . J. Smart. Environ. Green. Comput. 2022, 2, 90-104. http://dx.doi.org/10.20517/jsegc.2022.09
About This Article
Copyright

Data & Comments
Data


 Cite This Article 16 clicks

 Like This Article 3
likes
Like This Article 3
likes


Comments
Comments must be written in English. Spam, offensive content, impersonation, and private information will not be permitted. If any comment is reported and identified as inappropriate content by OAE staff, the comment will be removed without notice. If you have any queries or need any help, please contact us at support@oaepublish.com.